# Class 1 Risk Assessments
This section documents the procedure for performing Class 1 risk assessments. Within the risk assessment classification taxonomy, Class 1 assessments are the highest-level. They are the quickest to complete and require the least amount of expertise. The final results are qualitative (e.g., High, Medium, or Low), and its results have lower confidence than the higher classes of risk assessments.
The Recommended Use section outlines the recommended use for Class 1 risk assessments. The Methodology section details the overall Class 1 methodology. It should be noted that this methodology is hazard- and asset-agnostic. It is generic enough to be able to be applied to any hazard or asset type, but specific guidance is provided for four risk metrics: downtime, repair/replacement cost, inventory loss, and occupant health. The Case Study section provides a case study from a real project: Arup Climate Risk Assessment.
# Recommended Use
Class 1 risk assessments are most commonly performed for clients for the following purposes:
General awareness of risks. For this purpose, risks are assessed to provide the client a more general understanding of their risks, often before specific decisions are even identified as needing to be made. This is commonly an initial engagement with a client to provide a high-level understanding of what risks are present and how they compare to each other. With this initial understanding, the client is then empowered to identify decisions that need to be made, or further analysis that may need to be completed.
Site selection or other low-cost decisions. For this purpose, risks are compared between assets (or prospective assets) and/or hazards so that a low-cost decision can be made about the asset(s). A common low-cost decision is site selection: if there are a few prospective locations for a new asset, which of them has the lowest risk for natural hazards? This decision would be “low-cost” if it is not significantly more expensive to place the asset in one site compared to another and if the consequences of mistakenly choosing the higher-risk site are relatively low. Another low-cost decision could be whether to implement a relatively cheap mitigation strategy, such as anchoring certain non-structural components. It is important that the decision is low-cost, because it implies that the decision can be made on the basis of a Class 1 assessment alone, and it may not be worth the added certainty that comes with a more in-depth assessment (i.e., Class 2, 3, or 4).
Prioritization of assets and/or hazards for more detailed analysis to make high-cost decisions. For this purpose, risks may be evaluated to determine if more detailed analysis is warranted before making high-cost decisions, such as implementation of costly physical mitigations or complete divestment of an asset. As an example, most clients want to invest most efficiently by mitigating only against the highest-risk assets and hazards, but it may not be feasible to perform the most sophisticated modeling of all possible assets and hazards. Therefore, a Class 1 assessment can identify the assets and/or hazards that pose elevated risks and justify more detailed analysis (i.e., Class 2, 3, or 4) for higher-confidence risk assessment and associated cost-benefit. Then the most efficient mitigation strategies can by identified based on this more detailed analysis.
# Methodology
There are two types of methodologies for performing a Class 1 assessment:
Standard desktop study
Generic archetype-based analysis
To determine the appropriate method for your project, check the Standard Operating Procedures (SOPs) for the latest inormation on hazard-by-hazard Class 1 assessment methodologies. If archetype consequence curves have been developed for the relevant hazard, then a generic archetype-based analysis should be performed. If archetype consequence curves have not been developed for the relevant hazard, then a standard desktop study should be performed. If an applicable Class 1 SOP has not yet been developed for the relevant hazard, then you will need to perform a Class 2 assessment (i.e. site-specific desktop study).
The remainder of this section will provide a step-by-step high-level overview of the two types of Class 1 methodologies. Where relevant, distinctions between the standard desktop study and the generic archtype-based analysis will be highlightd. The SOPs contain hazard-specific instructions for performing Class 1 assessments and should be consulted for project work.
The following steps provide a high-level overview of the method for performing a Class 1 assessment:
- Determine the risk metric(s) to assess.
Typical risk metrics include financial loss, downtime, and life safety. Other risk metrics may be assessed at the discretion of the scope of work and client preferences.
This step is the same for both standard desktop studies and generic archetype-based analyses.
- Based on the risk metric(s), construct a “risk matrix” and/or the associated "AAL table".
The “risk matrix” relates the likelihood of an impacting event and the associated consequence to a “risk rating” (or “qualitative descriptor of risk”). The makeup of the risk matrix depends on the risk metric(s) being assessed and the risk tolerance of the client. In many cases, the risk matrix is calibrated such that each qualitative descriptor corresponds to a range of average annual loss (AAL). In such cases, an "AAL table" can be developed that is associated with the risk matrix.
As long as the client agrees to the risk matrix being used in the risk assessment, there are no strict rules for how to construct a risk matrix for a specific project, but the Risk and Resilience team in San Francisco have developed a set of standard risk matrices for four risk metrics (repair cost, downtime, inventory loss, and life safety) and three standard levels of client risk tolerance (“risk neutral”, “risk averse”, and “risk tolerant”). The standard “risk neutral” risk matrices for repair cost, downtime, and life safety are shown below and are used for the majority of clients. For brevity, the standard risk matrix for inventory loss for a risk neutral client is not shown because it is identical to that for repair cost.
Figure 5. Risk matrix for repair cost for a risk neutral client.
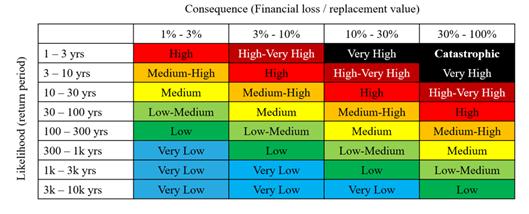
Figure 6. Risk matrix for downtime for a risk neutral client.
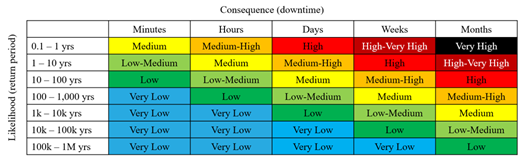
Figure 7. Risk matrix for life safety (fatality) for a risk neutral client.
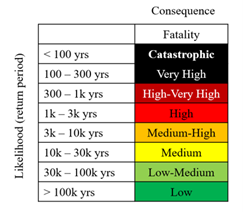
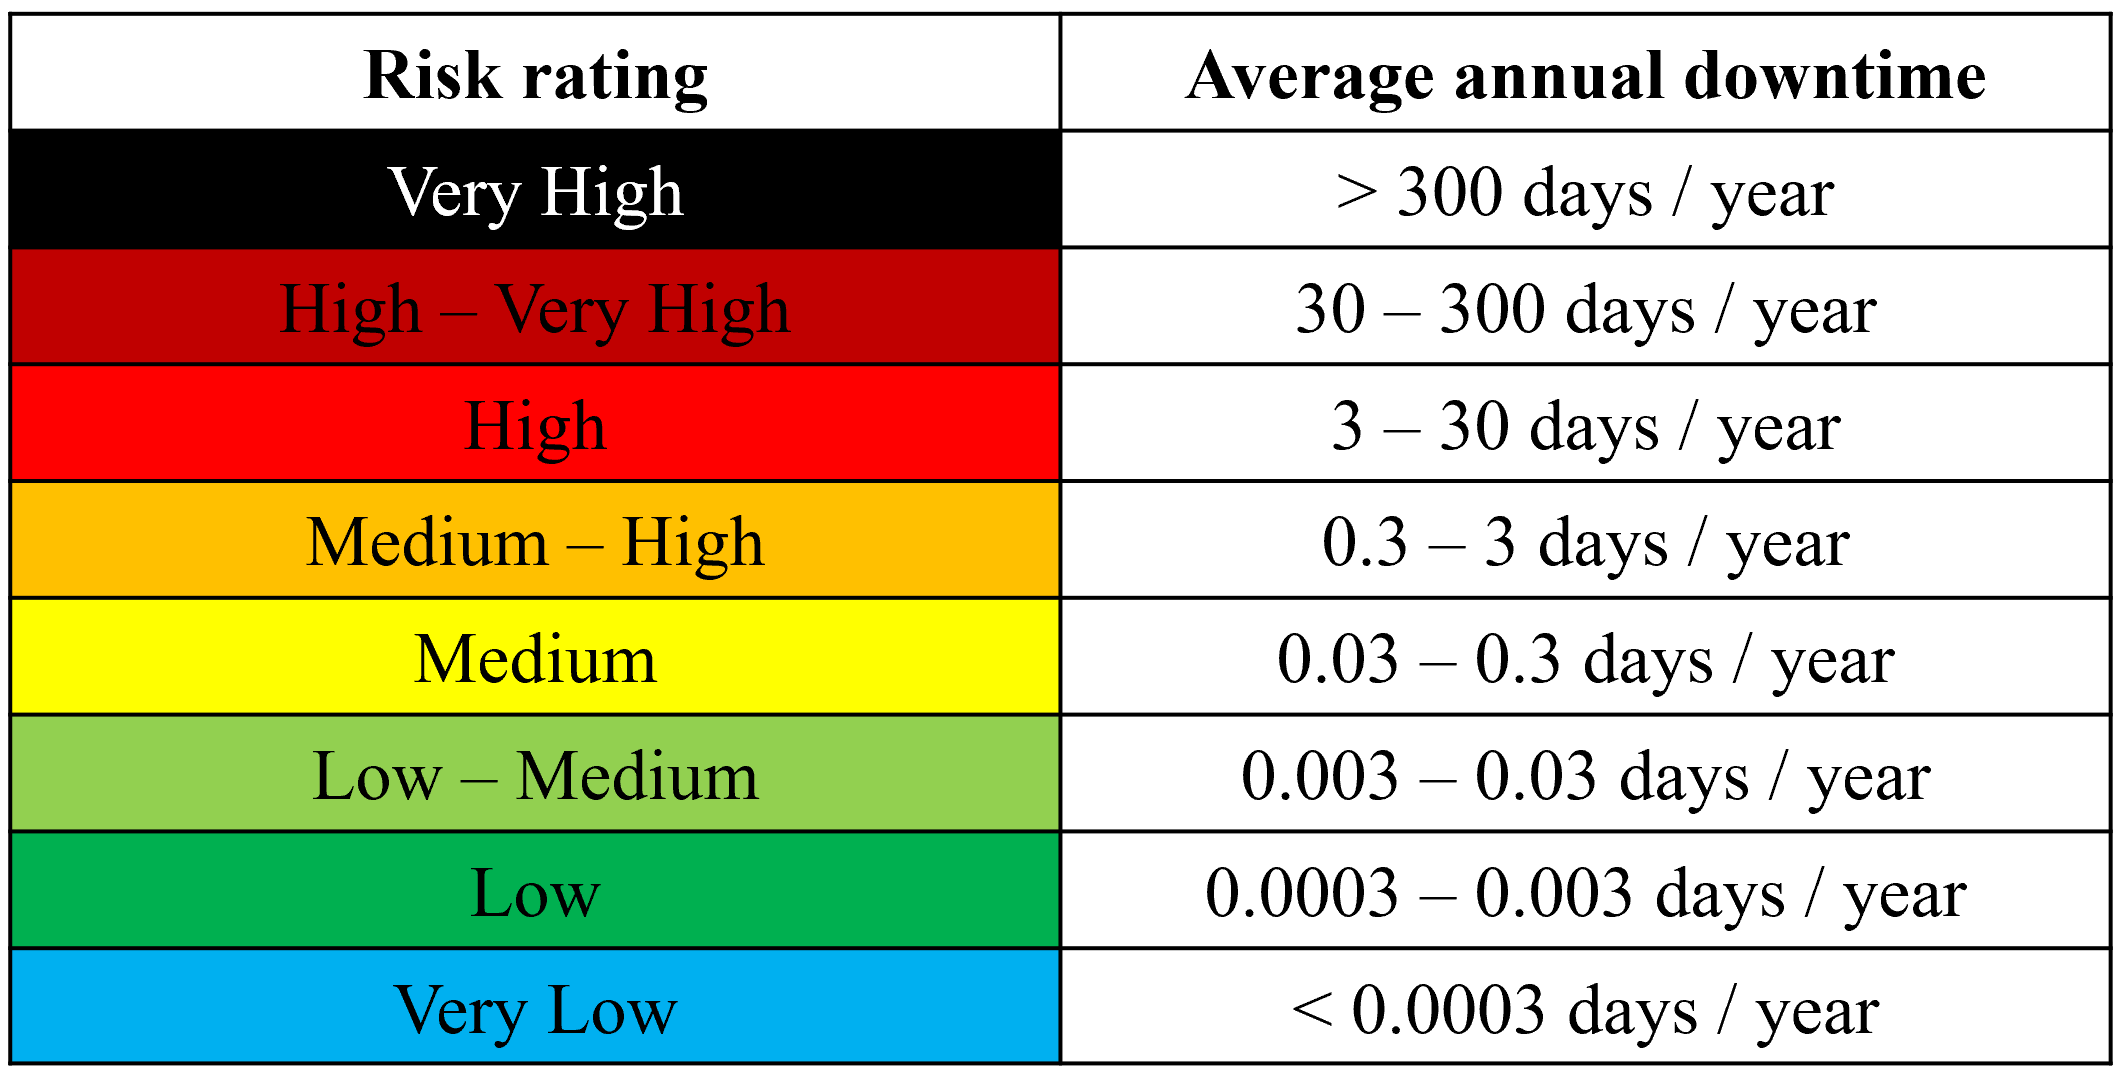
The AAL tables associated with the standard risk neutral risk matrices for repair cost and downtime are shown below. Note that the life safety risk matrix is an AAL table in its own right, so it does not have a separate associated AAL table.
Figure 8. AAL table for repair cost for a risk neutral client.
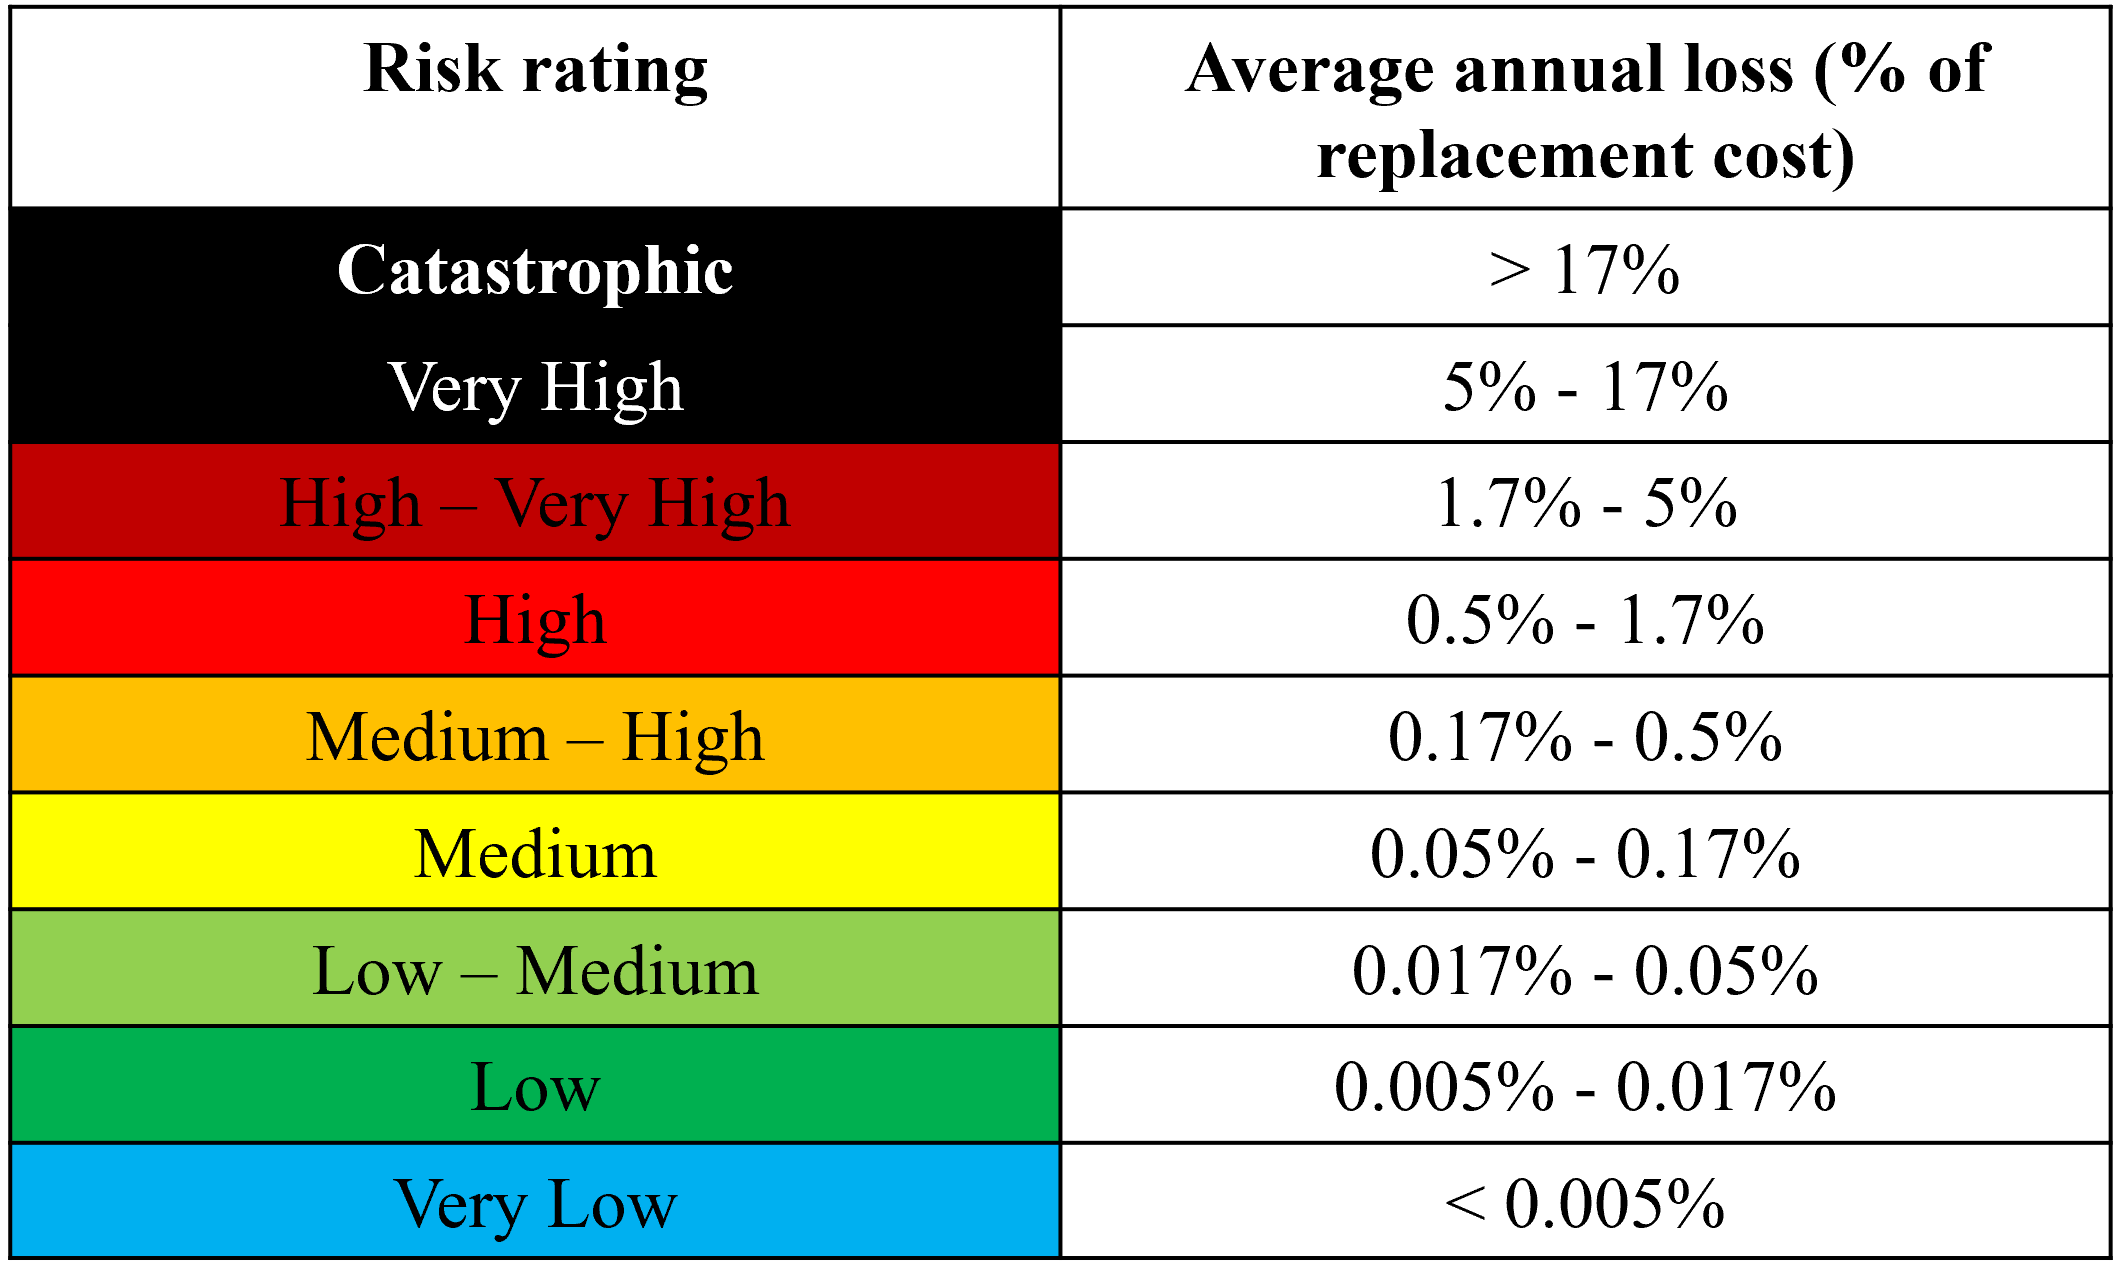
Figure 9. AAL table for downtime for a risk neutral client.
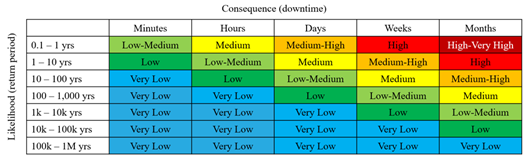
For a risk averse client, the standard risk matrices have ratings that are one “level” higher than for a risk neutral client. Conversely, for a risk neutral client, the standard risk matrices have risk ratings that are one level lower than for a risk neutral client. A typical example of a risk averse client is a data center client, who may be risk averse to downtime because reliability of their assets is critical to their business. To demonstrate what risk averse and risk neutral risk matrices look like, the standard risk matrices for downtime for a risk averse client and for a risk neutral client are shown below.
Figure 10. Risk matrix for downtime for a risk averse client.
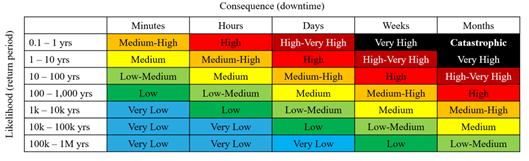
Figure 11. Risk matrix for downtime for a risk tolerant client.
Although there are no strict rules for developing a risk matrix for a specific project, if it is desired to use a risk matrix other than the standard risk matrices detailed above, the following guidelines are recommended:
- Use approximately logarithmic scaling for the likelihood (rows) and consequence (columns).
- For risk metrics that have no upper bound (e.g., downtime), the range of consequences representing a single column should be bounded by approximately 10x (one order of magnitude). For risk metrics that have an upper bound (e.g., repair cost, which is bounded by the replacement cost of the asset), the range of consequences representing a single column should be bounded by approximately 3x (~one half order of magnitude).
- The range of likelihoods representing a single row should be bounded by the same range as the columns.
- The risk ratings should be the same across the diagonal of the risk matrix.
The guidelines above ensure that a single risk rating (e.g., “Medium”) approximately represents an equivalent range of AAL.
This step is, in general, the same for both standard desktop studies and generic archetype-based analyses. It should be noted that if a generic archetype-based analysis is performed, an AAL table must be developed.
- Quantify hazard.
For Class 1 assessments, hazard data is obtained from publicly available information based on the location of the asset. The Class 1 SOPs contain specific instructions for obtaining this information. This could be as simple as the return period and intensity of a single representative event (e.g. the 500-year flood depth) or a hazard curve that contains multiple return period / intensity pairs (e.g. the 10-year, 50-year, 100-year, 500-year, and 1,000-year flood depths). For generic archetype-based analyses, it is more common to obtain a hazard curve with multiple return periods.
- Quantify exposure.
For Class 1 assessments, an asset's exposure is quantified by identifying the archetype (e.g. "modern high-rise office building") that best represents the key characteristics of the asset. These archetypes may be slightly different depending on which hazard is being assessed. The Class 1 SOPs contain information for how to identify the archetype that best represents the asset being assessed.
- Quantify vulnerability and consequences.
For Class 1 assessments, the quantification of vulnerability and consequences is done differently if a standard desktop study or a generic archetype-based analysis is performed.
For standard desktop studies, vulnerability and consequences are typically assessed separately as part of a two-step process. To assess vulnerability, the analyst must identify at least one damage state that the asset can experience due to the hazard. For each identified damage state, the analyst should identify the “critical” hazard intensity at which the damage state is possible. To assess consequences, the analyst must assign a consequence to each identified damage state. The Class 1 SOPs contain information about standard damage states and associated consequences (based on asset type) that can be used for Class 1 assessments.
For generic archetype-based analyses, vulnerability and consequences are typically assessed simultaneously in a single step. An appropriate consequence curve (which provides expected consequence as a function of hazard intensity) must be identified. The Class 1 SOPs contain information for how to obtain generic archetype consequence curves that can be used for Class 1 assessments.
- Determine risk rating.
For Class 1 assessments, the determination of the risk rating is done differently if a standard desktop study or a generic archetype-based analysis is performed. In both cases the risk rating is typically determined based on the estimated average annual loss for the asset.
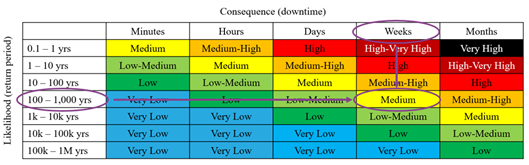
For standard desktop studies, the risk rating is assigned using the risk matrix from Step 2. To do this, the analyst must estimate the likelihood (i.e. return period) and consequence for each damage state identified in Step 5. Consider, for example, a Class 1 assessment for downtime for a risk neutral client. For each damage state, the analyst should select the associated likelihood and consequence ranges corresponding to the risk matrix identified in Step 2. If there are multiple damage states, the analyst should select the results of the damage state that results in the highest risk rating. Based on the identified ranges of likelihood and consequence, the risk rating can be assigned using the risk matrix from Step 2. Consider, for example, a Class 1 assessment for downtime for a risk neutral client. If it was identified that a likelihood range of “100-1,000 years” and a consequence range of “Weeks” is appropriate, then the risk rating would be assigned to be Medium (because of the implied average annual downtime associated with the applicable likelihood and consequence ranges) See figure below for a visualization of this example.
Figure 12. Example of the assignment of a Medium risk rating for downtime for a risk neutral client.
For generic archetype-based analyses, the risk rating is assigned by calculating the average annual loss for the relevant risk metric. This is done by integrating the hazard curve from Step 3 with the consequence curve from Step 5. This is typically calculated automatically through Iris, but can also be done manually using numerical integration with either Excel or a simple script (e.g., in Python). The integral to be solved is shown below:
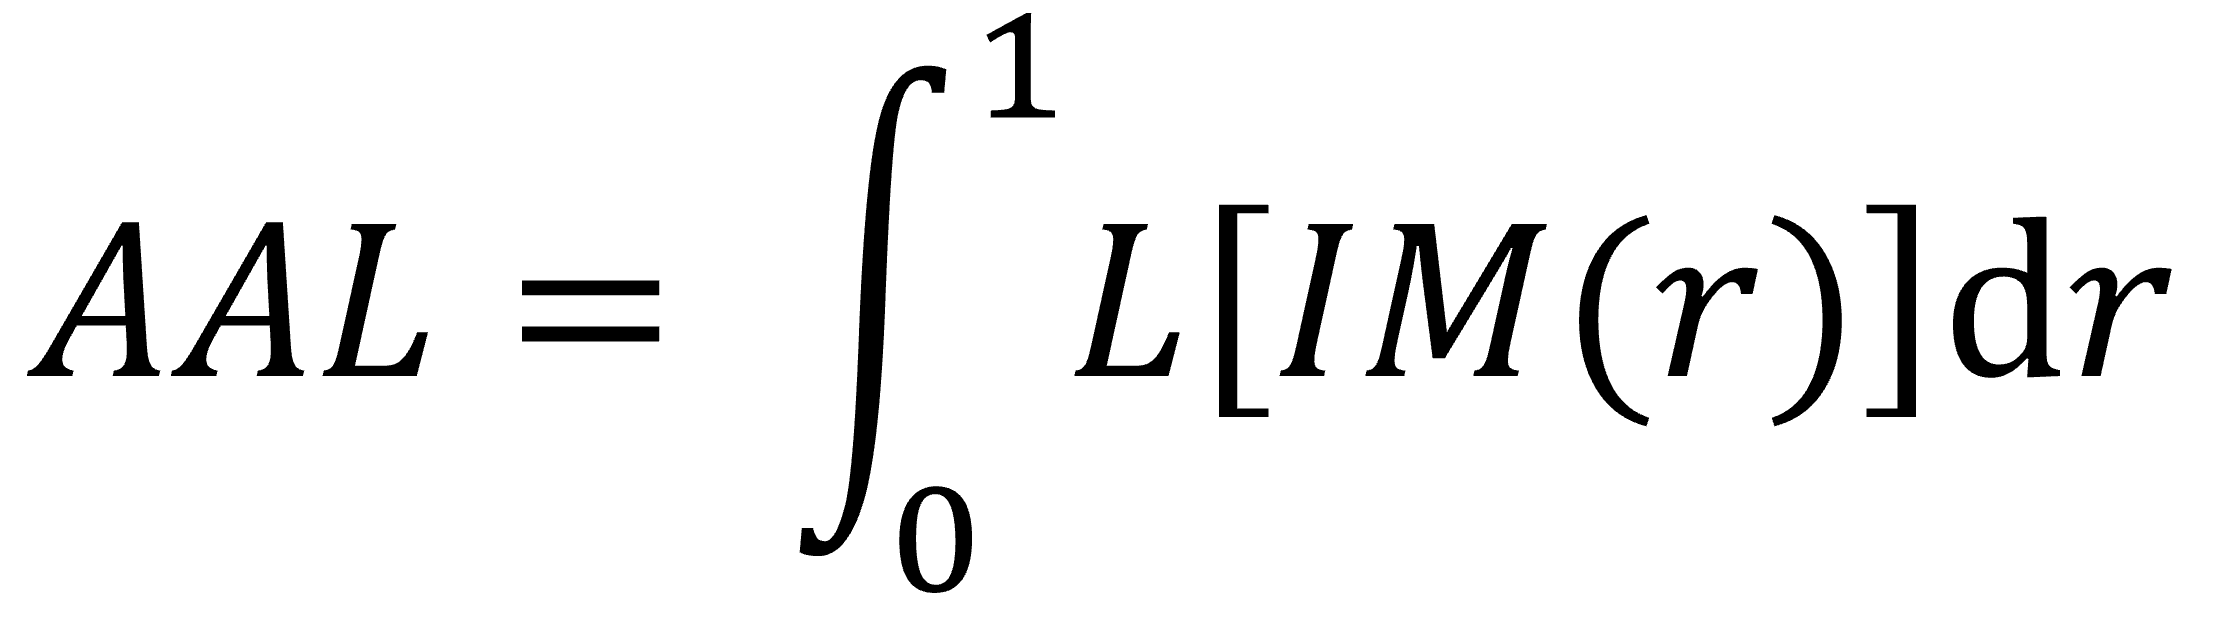
where L[IM] is the consequence curve (i.e. loss as a function of hazard intensity measure, IM), IM(r) is the hazard curve (i.e. IM as a function of annual rate, r), and AAL is the average annual loss. Based on the calculated AAL, the risk rating can be assigned using the AAL table from Step 2. Consider again, for example, a Class 1 assessment for downtime for a risk neutral client. If it was calculated that the average annual downtime was 0.15 days / year, then referencing the AAL table for downtime for a risk neutral client from Step 2 would indiciate that a "Medium" risk rating (corresponding to 0.03 - 0.3 days / year of downtime) should be assigned.
# Case study: Arup Climate Risk Assessment (seismic risk)
For a case study of a Class 1 risk assessment using a standard desktop study, the scope of work of the Arup Climate Risk Assessment that encompassess a seismic risk assessmnt for Arup offices in the United States is summarized here.
This portion of the assessment summarized here has the following scope:
- Hazard: Earthquake shaking
- Assets: Office buildings
- Risk metric: Downtime
It should be noted that this scope of work was completed in early 2023 following the methodology in the Class 1 SOP for earthquake shaking that was available at the time of the project.
The steps outlined in the Methodology section for Class 1 assessments are followed here:
Determine the risk metric(s) to assess. As explained above, this case study considers downtime as the risk metric.
Based on the risk metric(s), construct a “risk matrix” and/or the associated "AAL table". For the Arup Climate Risk Assessment, the standard downtime risk matrix and AAL table for downtime for a risk neutral client were used. See the Methodology section for Class 1 risk assessments for graphics of these standard tables.
Quantify hazard. For the Arup Climate Risk Assessment, for office locations in the United States, the 475-year peak ground acceleration (PGA) was obtained from the USGS unified hazard tool (opens new window).
Quantify exposure. For the Arup Climate Risk Assessment, it was assumed that each office building was a modern steel and/or concrete high-rise building. Different arcehtypes were then assigned to each individual office building based on whether it was determined to have been designed to "Low Code", "Moderate Code", or "High Code". These code classifications were determined from on the 475-year PGA at the location of the building (Step 3).
Quantify vulnerability and consequences. For the Arup Climate Risk Assessment, standard damage states from the Class 1 SOP were determined for the modern steel and/or concrete high-rise building archetype (identified in Step 3) and are summarized in the table below for Low Code, Moderate Code, and High Code design levels.
Table 3. Standard damage states and associated peak ground acceleration (PGA) used in Arup Climate Risk Assessment for seismic risk.
| Damage State | Low Code PGA | Moderate Code PGA | High Code PGA |
|---|---|---|---|
| Slight | 0.08g | 0.12g | 0.17g |
| Moderate | 0.13g | 0.18g | 0.26g |
| Extensive | 0.27g | 0.38g | 0.65g |
| Complete | 0.51g | 0.72g | 1.03g |
Standard consequence values (in terms of downtime) from the Class 1 SOP were identified for commercial buildings and are summarized in the table below.
Table 4. Standard damage states and consequence, in terms of downtime, used in Arup Climate Risk Assessment for seismic risk.
| Damage State | Downtime |
|---|---|
| Slight | 10 days |
| Moderate | 90 days |
| Extensive | 270 days |
| Complete | 360 days |
- Determine risk rating. For the Arup Climate Risk Assessment, for each office in the United States, the downtime expected in 475-year shaking was estimated by using the 475-year PGA value determined from Step 3 and identifying the expected damage state and corresponding downtime based on the tables in Step 5. Then using the risk matrix from Step 2, risk ratings could be identified for each office. As an example, for Arup's Seattle office, the 475-year PGA is 0.29g and it is located in a "Moderate Code" seismic zone. Therefore, from the tables in Step 5, it is expected in 475-year shaking to have a Moderate damage state, leading to 90 days of downtime. Based on the risk matrix for downtime for a risk neutral client, this corresponds to a likelihood range of "100-1,000 years", a consequence range of "Months", and, therefore, a Medium-High risk rating is assigned to Arup's Seattle office. For this project, the seismic risk ratings for all Arup offices in the United States where assigned in Iris and the results can be visualized in the figure below.
Figure 13. Summary of seismic risk ratings assigned for Arup offices in the United States and Canada. Image is from Iris. Green indicates Low risk, Yellow indicates Medium risk, Orange indicates Medium-High risk, and Red indicates High risk.
