# Class 2 Risk Assessments
This section documents the procedure for performing Class 2 assessments. Within the risk assessment classification taxonomy, Class 2 assessments are more detailed than Class 1 assessments, but do not require the same level of site-specific hazard analysis, component-based modeling, or Monte Carlo methods as Class 3 or Class 4 assessments. Class 2 assessments require some amount of risk modeling expertise, but the analyst does not necessarily need to be a subject matter expert. The final results are quantitative (e.g., expected financial losses and downtime) but are not deaggregated by component within the asset, and the results have more uncertainty than those of Class 3 or Class 4 assessments. Average annual loss (AAL) is a typical result of a Class 2 assessment.
The Recomended Use section outlines the recommended use for Class 2 risk assessments. The Methodology section details the overall Class 1 methodology. It should be noted that this methodology is hazard- and asset-agnostic. It is generic enough to be able to be applied to any hazard or asset type, but specific guidance is provided for three risk metrics: downtime, repair/replacement cost, and life safety. The Case Study section provides a case study from a real project: Stanford University Climate Vulnerability and Impact Assessment.
# Recommended Use
Class 2 risk assessments are most commonly performed for clients for the following purposes:
Risk-informed early feasibility of mitigations, design enhancements, and other operational improvements. For this purpose, risks are assessed for early identification of interventions that can reduce risks that are deemed intolerable. Unlike Class 1 assessments, Class 2 assessments can, if necessary, provide results in terms of quantitative metrics (e.g., financial losses and downtime) which can be compared to other types of risks not necessarily tied to natural hazards (e.g., financial downturns, supply chain disruptions etc.) to help conceptualize what types of interventions may be worth consideration. For clients with 100s to 1,000s of assets analyzed with Class 2 assessments, this level of analysis may be sufficient to begin to prioritize mitigation measures and other types of interventions. For clients with fewer assets analyzed with Class 2 assessments, more detailed analysis may be warranted (see next paragraph).
Prioritization of assets and/or hazards for more detailed analysis to make high-cost decisions. For this purpose, risks may be evaluated to determine if more detailed analysis is warranted before making high-cost decisions, such as implementation of costly physical mitigations or complete divestment of an asset. As an example, most clients want to invest most efficiently by mitigating only against the highest-risk assets and hazards, but it may not be feasible to perform the most sophisticated modeling of all possible assets and hazards. Therefore, a Class 2 assessment (like a Class 1 assessment) can identify the assets and/or hazards that pose elevated risks and justify more detailed analysis (i.e., Class 3 or 4) for higher-confidence risk assessment and associated cost-benefit. Then the most efficient mitigation strategies can by identified based on this more detailed analysis. It should be noted that this use-case is applicable for both Class 1 and Class 2 assessments, but a Class 2 assessment will provide higher confidence in the results than a corresponding Class 1 assessment based on site-specific considerations, and, if arcehtypes are available, can provide a more refined view of absolute risks via quantitative metrics like espected repair cost and downtime.
High-level evaluation of non-standard hazards. For this purpose, risks are assessed, typically via enhanced desktop study, for non-standard hazards (e.g. dust storm, hail, industrial facility adjacency, etc.) for which SOPs have not yet been developed and therefore Class 1 assessment is not possible. Assets for some clients may be especially at-risk to one or more non-standard hazards (either because of special characteristics of the asset or because of the asset's location) and may require a high-level risk assessment for a hazard for which a Class 1 SOP has not yet been developed. In this case, a Class 2 enhanced desktop study is appropriate, in which the methodology for the desktop study is tailored for the relevant client and/or hazard.
# Methodology
The methodology for performing a Class 2 assessment for a specific asset and hazard is provided below. As is typical, this methodology is followed to calculate average annual loss (AAL). An example is followed through analyzing the risk of flood damage to a utility substation to determine AAL in terms of downtime.
- Develop a hazard curve for the asset location.
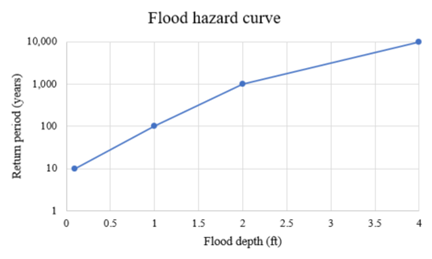
For a Class 2 assessment, this is typically done by identifying a publicly available source or, if necessary, a cursory study of the site. See below for an example flood hazard curve.
Figure 19. Example of a flood hazard curve.
- Develop a fragility curve for each damage state associated with the asset.
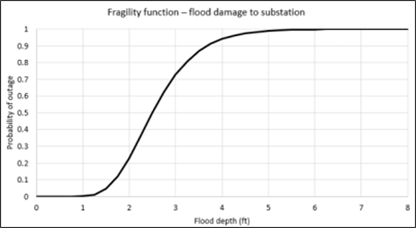
For a Class 2 assessment, this is typically done by identifying publicly available fragility curves and adapting them to the asset under consideration, if necessary. See below for an example fragility curve for a single damage state: flood damage to a substation such that the substation must be repaired.
Figure 20. Example of a fragility curve for flood damage to a substation.
- Integrate the hazard curve with each fragility curve to calculate the annual rate of occurrence.
For a Class 2 assessment, this is typically solved using numerical integration with either Excel or a simple script (e.g., in Python). The integral to be solved is shown below:

where λ[DS] is the annual rate of occurrence of the damage state DS, G[DS|IM] is the probability density function representing the fragility curve (note that the associated cumulative distribution is what is typically visualized), and λ[IM] is the annual rate of exceedance for the hazard intensity measure IM. If there are multiple damage states, the integral above should be computed for each damage state.
For the flood hazard curve and the substation flood fragility curve shown in the figures above, solving the integral in the equation above leads to an annual rate of occurrence of flood damage to the substation of about 0.00081, or a return period of about 1,250 years.
- Develop an average consequence for each damage state.
For a Class 2 assessment, this is either done by taking the mean of a consequence curve (typically identified from a publicly available source) or estimating the consequence based on judgement from past projects. For the considered example of flood damage to a substation, the average consequence is 14 days of downtime.
- Multiply the annual rate of occurrence by the average consequence for each damage state and take the sum to calculate the average annual loss (AAL).
For the considered example of flood damage to a substation, this leads to an average annual loss, in terms of downtime, of 0.00081 occurrences / year * 14 days of downtime / occurrence = 0.011 days of downtime / year = 0.27 hours of downtime / year. Therefore, for the considered example, the AAL = 0.27 hours / year of downtime.
# Case study: Stanford University Climate Vulnerability and Impact Assessment
For a case study of a Class 2 risk assessment using an enhanced desktop study, a portion of the Stanford University Climate Vulnerability and Impact Assessment is summarized here.
This portion of the assessment summarized here has the following scope:
- Hazard: Heat
- Assets: (1) Childcare facility with no air conditioning, and (2) Classroom building with air conditioning
- Risk metric: Occupant health
It should be noted that this assessment considered future climate impacts of climate change, but the portion of the case study presented here will focus on current risks (i.e., not considering climate change).
The steps outlined in the Methodology section are followed here:
- Determine the risk metric(s) to assess. As explained above, this case study considers occupant health as the risk metric.
- Based on the risk metric(s), construct a “risk matrix”. For the Stanford University Climate Vulnerability and Impact Assessment, a risk matrix for occupant health was developed and is shown below, along with an associated figure that describes the consequence level definitions.
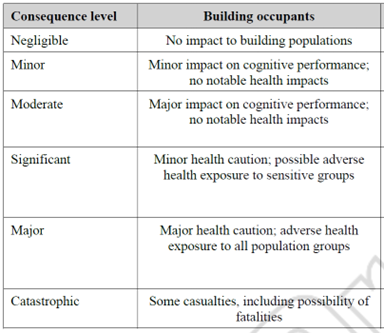
Figure 13. Risk matrix developed for occupant health. The consequence levels are defined in the figure below.
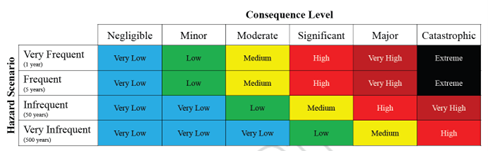
Figure 14. Definitions of the consequence levels associated with occupant health.
- Determine the range of Likelihood and associated range of Consequence that results in the highest risk rating. This must be done for each hazard (heat and wildfire smoke) and for each asset (childcare facility with no air conditioning, and classroom building with air conditioning).
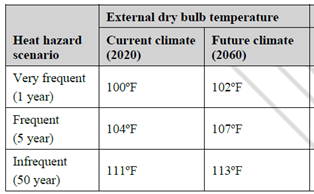
For heat, the hazard intensity associated with the first three likelihood rows were identified and are summarized below.
Figure 15. Summary of heat hazard intensity for Very frequent, Frequent, and Infrequent likelihoods. Note that only the values for current climate are relevant for the considered scope.
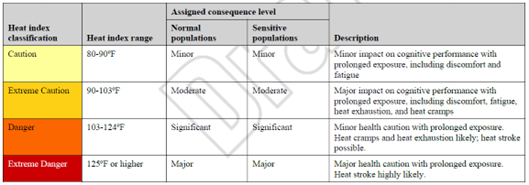
For heat, four damage states were identified based on heat index range and the population in the buildings, summarized in the figure below with associated consequence levels.
Figure 16. Damage states and associated consequence levels assigned to building occupants for heat hazard.
For heat, the vulnerabilities of the assets were determined based on the level of air conditioning. For unconditioned buildings, the inside air temperature was assumed to be 5°F hotter than the outside air temperature. For conditioned buildings, the inside air temperature was assumed to be 10°F cooler than the outside air temperature.
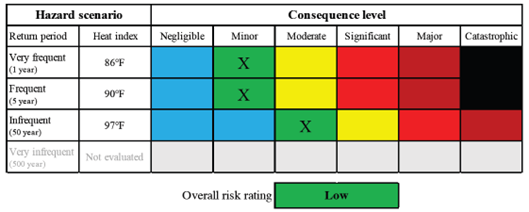
For the two assets considered in this scope, the childcare facility had a sensitive population and no air conditioning while the classroom building had a normal population and air conditioning. The risk rating assignments can be summarized by the figures below for the two assets.
Figure 17. Summary of risk rating assignment for heat for childcare facility, which has a sensitive population and no air conditioning.
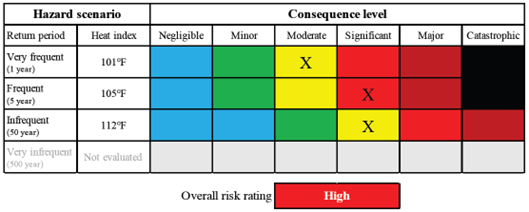
Figure 18. Summary of risk rating assignment for heat for classroom building, which has a normal population and air conditioning.