# Flood SOP
Last updated April 14, 2023 by Kenny Buyco
# Scope
- Hazard: Flood Depth (Riverine/Fluvial, Coastal, Stormwater/Pluvial, Integrated)
- Asset types: Buildings
- Consequences: Downtime, Repair Cost
- Region: Global
# Introduction
Flooding can be caused by several sources: rivers (fluvial), stormwater (pluvial), storm surge (coastal), and more (e.g., dam burst). In riverine flooding, the existing banks overflow and water escapes into the surrounding floodplain. In pluvial flooding, water flows over land and collects in basins or ponds at local low points. In coastal flooding, water builds up against the coastline during storm events and the water level can increase due to tides and wave action. In all of these cases, flooding can inundate buildings and cause substantial damage and significant consequences like financial loss and downtime.
The risk assessment methodology described herein focuses on flood risk in terms of downtime and financial loss. Currently, 3 workflows for building-level risk assessments are detailed in this SOP – 1) within Iris for a single asset, 2) within Iris for multiple assets, and 3) conceptual / off-platform analysis. The perusal of this SOP should provide a step-by-step guide to implement any one of the 3 workflows to assess building-level risk to repair costs and downtime from flood depths.
# Overview of Risk Classes
| Description | Class 1 | Class 2 | Class 3/4 |
|---|---|---|---|
| Hazard data | Option 1 - Provider: First Street Foundation - Geographic region(s) covered: Continental/contiguous United States - Type of flood hazard(s) available: Integrated - Return periods available: 5, 20, 50, 100, and 500 - Climate scenarios available: 15, 30 years into the future; RCP4.5 Resolution: 3m Option 2: Fathom Global v3.0 - Provider: Fathom Global - Geographic region(s) covered: Global Type of flood hazard(s) available: Fluvial, Pluvial, Coastal - Return periods available: 5, 10, 20, 50, 100, 200, 500, and 1,000 - Climate scenarios available: 2030, 2050; SSP1-2.6, SSP2-4.5, SSP5-8.5 - Resolution: 30m Option 3 - Custom model and inputs for return period and flood depth | Same as Class 1 | Site-specific hydrologic and hydraulic modeling |
| Exposure & Vulnerability data | Latitude, Longitude Building use Building height category (i.e., low-, mid-, or high-rise) Time factor Location Factor | Latitude, longitude Finished floor elevation (FFE) Building use Number of floors (including aboveground and belowground floors) Construction type One of the following: Building replacement cost or building area or building footprint area and number of floors Time factor Location factor | Floor areas and heights Building replacement cost and time Number of floors (including aboveground and belowground floors) Risk Parameters (1) Components in the building (2) Time factor Location factor |
| Time to set up project | Allocate 8hrs for project set-up in Iris | Allocate 8hrs for project set-up in Iris | Not yet developed |
| Time required to review and input exposure data | Assume data has been collected (add time estimate to proposal) Fewer than 30 sites: 30 min per site More than 30 sites: 15 minutes per site + 8hr batching setup | Assume data has been collected (add time estimate to proposal) Fewer than 30 sites: 90 min per site More than 30 sites: 60 minutes per site + 8hr batching setup | Not yet developed |
| Time required to review or obtain cost data (location & time factors, replacement value) | Not applicable for Class 1 | Allow 8hrs for cost team to provide regional location factors, appropriate time factor, and replacement value ($/sf) for 2-3 building types | Not yet developed |
| Time required to review hazard data and QA/QC risk results | Allocate 8h for R+R team support for R+R team QA/QC | Allocate maximum of 16h or 8h per 50 sites for R+R team QA/QC support | Not yet developed |
| Output | Qualitative risk ratings (e.g., High, Medium, Low) | Quantitative risk metrics (AAD, AAL) Qualitative risk ratings (e.g., High, Medium, Low) | Not yet developed |
1 Risk parameters such as information about the building repair sequences, impeding delays, and insurance information are necessary to run a C3 analysis. Typical values for these parameters are available to view in a C3 risk assessment in Iris. To learn more, contact the authors of this SOP. 2 The components with which a building is populated come from an existing components library curated by the San Francisco Risk & Resilience team. This components library is available for query in Iris. To learn more, contact the authors of this SOP.
# Class 1 Flood Risk Assessment for Building Downtime and Repair Cost
Please follow the steps enumerated in this section to obtain the expected downtime and repair costs for a flood risk analysis of buildings. This process will determine the hazard experienced at the asset, assign a vulnerability archetype to the building, and perform the risk analysis to get downtime and repair cost estimates on the asset.
The hazard data for each site, the building exposure information, and the vulnerability curves will be combined to produce risk results for this Class 1 Assessment.
If conducting an assessment for multiple hazards, required input data is best collected into a spreadsheet. Please see the C1 template in Appendix A and follow along with each section to input the required data for hazard, exposure, and vulnerability.
# Hazard
Step 1: Obtain Flood Hazard Curve
Conceptual
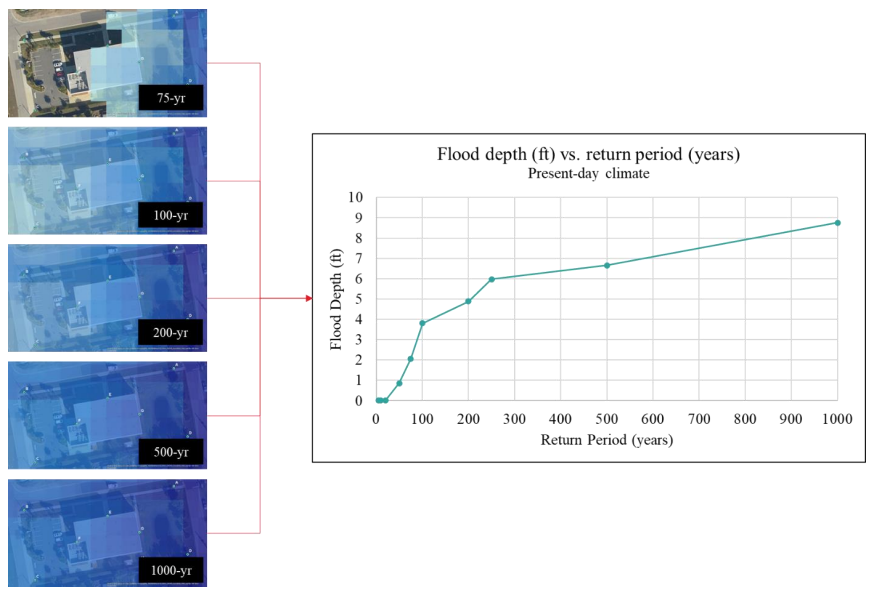
The flood hazard curve (i.e., flood depths at multiple return periods) is required to conduct a flood risk assessment. This hazard curve is obtained through selecting a singular flood depth (typically the maximum flood depth within the property boundary) that best represents the flood depth at the asset of interest for each return period available. See the figure below for an example of how a flood hazard curve is generated from multiple return-period flood maps.
The flood hazard data required to generate this curve can be automatically obtained from a flood data provider or it can be obtained from a local site-specific hydraulic model, run with precipitation and possibly riverine flows for multiple return periods.
Depending on the region in which your site is located, you may have multiple options of a flood hazard data provider. See below for the options currently available to you through Arup San Francisco Risk and Resilience team’s standing agreements with First Street Foundation (https://firststreet.org/) and Fathom Global (https://www.fathom.global/).
Option 1
- Provider: First Street Foundation
- Geographic region(s) covered: Continental/ contiguous United States
- Type of flood hazard(s) available: Integrated
- Return periods available (yrs.): 5, 20, 50, 100, and 500
- Climate scenarios available: 15, 30 years into the future; RCP4.5
- Resolution: 3m
Option 2: Fathom Global v3.0
- Provider: Fathom Global
- Geographic region(s) covered: Global
- Type of flood hazard(s) available: Fluvial, Pluvial, Coastal3
- Return periods available (yrs.): 5, 10, 20, 50, 100, 200, 500, and 1000
- Climate scenarios available: 2030, 2050; SSP1-2.6, SSP2-4.5, SSP5-8.5
- Resolution: 30m
3 Depending on your location, Fathom may provide a defended and undefended flood hazard layer for fluvial (riverine) and/or coastal
Note on flood hazard type Each flood hazard type (i.e., integrated, pluvial, fluvial, coastal) has its own set of return period-based flood maps from which the flood hazard curve is created. Therefore, if you wish to understand your flood risk from multiple flood hazard types, you must conduct as many risk assessments as flood hazard types of interest. If you elect to use flood hazard data provided by either FSF or Fathom, you will be limited to the flood hazard type available in their respective models.
Note on climate change Climate change can affect the flood hazard itself; therefore, for each climate scenario (e.g., a 2030 future climate under SSP2-4.5), there is a new set of return period-based flood maps from which the flood hazard curve is created. Therefore, if you wish to understand your flood risk from multiple climate scenarios, you must conduct as many risk assessments as climate scenarios of interest. For a given assessment, you can select either a present-day scenario or a future scenario. If you select a future scenario and elect to use flood hazard data provided by either FSF or Fathom, you will be limited to the climate scenarios available in their respective models.
In Iris, for 1 asset
- If conducting an assessment in Iris for a single asset, the Input Hazard tab will allow you to either manually input your own return period – flood depth pairs or lead you to a window where you can make the relevant selections to auto-populate your desired flood hazard data. When you have made the selections which best suit your assessment, click “Get Hazard.” This will call HAPI and also take you to a window where you can review and confirm your auto-populated hazard data. You can also download the .json and .csv formats of this hazard data. Once you select “Use Hazards,” you will be able to proceed to the next phase of the assessment.
In Iris, for multiple assets
- If conducting an assessment in Iris for multiple assets, you can repeat the process described above for all assets within the Iris GUI. Alternatively, if you have a large number of assets and want to auto-populate flood hazard data for all assets simultaneously, please fill out the assets’ latitudes and longitudes in the C1 template in Section 9.1 and email Jinal Mehta (Jinal.mehta@arup.com) and Tamika Bassman (Tamika.bassman@arup.com) to assist you with batching hazard data population for your asset portfolio.
Outside of Iris
- If conducting the assessment outside of Iris, please contact Jinal Mehta (Jinal.mehta@arup.com) and Stevan Gavrilovic (Stevan.gavrilovic@arup.com) to work with you to extract the hazard data you need.
3 Depending on your location, Fathom may provide a defended and undefended flood hazard layer for fluvial (riverine) and/or coastal
Step 2: Determine FFE and obtain Flood EDP Curve
Conceptual
Before conducting a risk assessment, we must understand how a given flood depth at the building translates to a flood depth inside the building. This is more generally known as the hazard’s engineering demand parameter (EDP). To determine the flood EDP curve, we need the building finished floor elevation (FFE) relative to the same datum used to determine the flood depths at the building used in the hazard curve. The equation to adjust the flood hazard curve to the flood EDP curve is given below:
Flood depth inside the building = Flood depth at the building – FFE
Determining FFE
In a Class 1 risk assessment, FFE is set at 0.5ft above the ground surface elevation.
# Exposure
If only assessing downtime risk, move ahead to the ‘Vulnerability’ section.
If assessing repair cost risk, please follow the following steps to obtain building height category, which is needed to calculate risk with respect to financial repair costs.
Step 1: Obtain relevant exposure parameters
Conceptual
Building height category (or number of floors)
In a C1 RA, determine the building height category using information on the number of floors for your asset. If the number of floors are not provided, you can look at OpenStreetMap or Google Earth satellite imagery to estimate an approximate height category (i.e., low-, mid-, or high-rise). Please use the following table as a guideline when estimating building height category:
| Building Height (for Iris) | Number of Stories |
|---|---|
| Low-rise | 1-2 |
| Mid-rise | 3-5 |
| High-rise | >5 |
Please follow the steps below to input or obtain your number of floors, depending on the interface you are using to conduct your risk assessment.
In Iris, for 1 asset
- Number of floors
- If you have the number of floors on hand, please input it in the Occupancy section of the Create/Edit Asset pop-up.
- If you do not have the number of floors on hand, Iris can use the archetypal number of floors based on the building height category when it is time to conduct the risk assessment. In this case, please leave the “Total aboveground floors” and “Total belowground floors” fields in the Create/Edit Asset pop-up blank. In the “Run Risk Analysis” pop-up, select the building height category that most accurately resembles your building. The number of floors will be automatically populated based on the building height category selected.
In Iris, for multiple assets
- If conducting an assessment in Iris for multiple assets, you can repeat the process described above for all assets within the Iris GUI. Alternatively, if you have a large number of assets and want to auto populate building height category in Iris for all assets simultaneously, please fill out the number of floors or building height category columns in the C2 template in Appendix A and email Jinal Mehta (Jinal.mehta@arup.com) and Tamika Bassman (Tamika.bassman@arup.com) to assist you with batching asset data population for your portfolio.
Outside of Iris
- Follow the steps in the Conceptual section above to set up your risk analysis workflow. Please contact the authors of this SOP, Jinal Mehta (Jinal.mehta@arup.com) and Meg Ackerson (meg.ackerson@arup.com) with any questions.
# Vulnerability
For flood, archetypal vulnerability curves which relate repair costs (in USD) and downtime (in days) to flood depths given in the hazard dataset need to be selected for each consequence type.
Building use type, construction type, building height category (related to number of stories), and presence of basement are required to assign the appropriate archetypal vulnerability curves to the building. More information about the building characteristics can be found in Appendix C1.
Step 1: Obtain relevant building characteristics and determine their corresponding archetype tag
- Use type – Please select the building use type (residential, retail, office) that most closely resembles your building. If the building has multiple use types, please select the use of the ground floor (also called first floor herein), which would be the first one to be exposed to flood hazard. If the building has a use type not within the above three options, please select the “office” use type.
- Height category - Please select the height category which most closely matches your building’s number of stories (determined in Exposure step).
- Other building characteristics, such as construction type and presence of basement, are fixed for a C1 RA. Please see below for further explanation on the specific assumptions made.
| Analysis Asssumption | Residential | Retail | Office/Other |
|---|---|---|---|
| Presence of basement (assumed) | Yes | No | No |
| Construction type (assumed) | Timber | Not timber | Not timber |
Step 2: Obtain vulnerability curves for each hazard and consequence pair
In total there are two vulnerability curves per archetype:
- Flood depth above FFE vs. repair cost per unit area (i.e., $/sqft)
- Flood depth above FFE vs. downtime
In Iris, for 1 asset
- After the archetype tags have been determined for all five building characteristics and input into the Assumed Building Characteristics section of the Run Risk Analysis pop-up, Iris will automatically select the appropriate archetypal vulnerability curves from the flood vulnerability curve database.
In Iris, for multiple assets
- If conducting an assessment in Iris for multiple assets, you can repeat the process described above for all assets within the Iris GUI. Alternatively, if you have a large number of assets and want to populate the appropriate assumed building characteristics in batch, please fill out the use type and height category columns in the C2 template in Section 9.1 and and email Jinal Mehta (Jinal.mehta@arup.com) and Tamika Bassman (Tamika.bassman@arup.com) to assist you with batching risk assessment characteristics for your portfolio.
Outside of Iris
- After the archetype tags have been determined for all four building characteristics, please select the appropriate repair cost and downtime vulnerability curves from the flood vulnerability curve database. The names of flood vulnerability archetypes are given in Section 9.3.2. The curves themselves are located in the Iris Resources SharePoint, under Technical Guidance and Resources, in the folder Flood Vulnerability Curves. Please contact the authors of this SOP, Jinal Mehta (Jinal.mehta@arup.com) and Meg Ackerson (meg.ackerson@arup.com) with any questions.
Step 3: Adjust archetypal vulnerability curves to your building.
If the risk analysis is for downtime consequence only, then curve adjustment is not needed, and this step can be skipped.
Now that the archetypal vulnerability curve has been determined, it must be adjusted to your building. For flood archetypes, the equation to convert the archetypal vulnerability curve (i.e., $/sqft loss vs. hazard IM) to the archetype-adjusted vulnerability curve (i.e., $ loss vs. hazard IM) is shown below.
$ loss | hazard IM = $/sqft | hazard IM * building footprint area * time factor * location factor
In a C1 Risk Assessment, the building footprint area is set based on the archetypal footprint area (to see your archetypal footprint area, refer to Appendix B1).
The time and location factors allow the costs to be scaled based on the year of the analysis and the individual building locations, as compared to the default year and location in the archetype database. The archetype database is anchored in 2021 USD with repair cost estimates for Washington, DC, USA. Arup’s cost team should be contacted for support in determining these factors to modify the repair costs accordingly. An estimate of hours has been provided in the Overview of Risk Classes.
In Iris, for 1 asset
- Iris will automatically generate the archetype-adjusted vulnerability curve for you based on your building characteristics and the risk parameters of your assessment (i.e., time factor, location factor).
In Iris, for multiple assets
- If conducting an assessment in Iris for multiple assets, you can repeat the process described above for all assets within the Iris GUI. Alternatively, if you have a large number of assets and want to populate the appropriate assumed building characteristics in batch, please fill out the time and location factor columns in the C1 template in Section 9.1 and email Jinal Mehta (Jinal.mehta@arup.com) and Tamika Bassman (Tamika.bassman@arup.com) to assist you with batching risk assessment characteristics for your portfolio.
Outside of Iris
- Follow the process described above to covert your archetypal vulnerability curves into archetype-adjusted vulnerability curves. Please contact the authors of this SOP, Jinal Mehta (Jinal.mehta@arup.com) and Meg Ackerson (meg.ackerson@arup.com) with any questions.
# Risk Determination
Now that the hazard, exposure, and vulnerability data has been collected, the risk can be determined for a given building.
Conceptual
Please see Appendix D1 Determining average annual loss (AAL) from return-period losses for a conceptual overview of going from the hazard data (i.e., hazard intensity vs. return period) and vulnerability curve selected (i.e., hazard intensity vs. consequence) to risk metrics such as average annual loss and average annual downtime.
In Iris, for 1 asset
- In the Run Risk Analysis pop-up, ensure your exposure and vulnerability inputs are correct and press “Run Risk Analysis”
- In the risk metrics output pane,
- For each flood depth, see the losses, % loss, and time to recover for each return period assessed.
- See the AAL and AAD and the corresponding qualitative risk ratings.
In Iris, for multiple assets
- If conducting an assessment in Iris for multiple assets, you can repeat the process described above for all assets within the Iris GUI. Alternatively, if you have a large number of assets and want to conduct risk assessments in batch, please email Jinal Mehta (Jinal.mehta@arup.com) and Tamika Bassman (Tamika.bassman@arup.com) to assist you with batching risk assessments for your portfolio.
Outside of Iris
- Follow the steps in the Conceptual section above to set up your risk analysis workflow. Please contact the authors of this SOP, Jinal Mehta (Jinal.mehta@arup.com) and Meg Ackerson (meg.ackerson@arup.com) with any questions.
# Iris Interface for a Class 2 Flood Risk Assessment
Creating or updating an asset
Creating a risk assessment on an asset
Input Risk Parameters
Input Hazard Information
View risk metrics and optionally publish risk ratings
# Class 2 Flood Risk Assessment for Building Downtime and Repair Cost
Please follow the steps enumerated in this section to obtain the expected downtime and repair costs for a flood risk analysis of buildings. This process will determine the hazard experienced at the asset, assign a vulnerability archetype to the building, and perform the risk analysis to get downtime and repair cost estimates on the asset.
The hazard data for each site, the building exposure information, and the vulnerability curves will be combined to produce risk results for this Class 2 Assessment.
If conducting an assessment for multiple hazards, required input data is best collected into a spreadsheet. Please see the C2 template in Appendix A and follow along with each section to input the required data for hazard, exposure, and vulnerability.
# Hazard
Step 1: Obtain Flood Hazard Curve
Conceptual
The flood hazard curve (i.e., flood depths at multiple return periods) is required to conduct a flood risk assessment. This hazard curve is obtained through selecting a singular flood depth (typically the maximum flood depth within the property boundary) for each return period where hazard data is available. See the figure below for an example of how a flood hazard curve is generated from multiple return-period flood maps.
The flood hazard data required to generate this curve can be automatically obtained from a flood data provider or it can be obtained from a local site-specific hydraulic model, run with precipitation and possibly riverine flows for multiple return periods.
Depending on the region in which your site is located, you may have multiple options of a flood hazard data provider. See below for the options currently available to you through Arup San Francisco Risk and Resilience team’s standing agreements with First Street Foundation (https://firststreet.org/) and Fathom Global (https://www.fathom.global/).
Option 1
- Provider: First Street Foundation
- Geographic region(s) covered: Continental/ contiguous United States
- Type of flood hazard(s) available: Integrated
- Return periods available: 5, 20, 50, 100, and 500
- Climate scenarios available: 15, 30 years into the future; RCP4.5
- Resolution: 3m
Option 2: Fathom Global v3.0
- Provider: Fathom Global
- Geographic region(s) covered: Global
- Type of flood hazard(s) available: Fluvial, Pluvial, Coastal
- Return periods available: 5, 10, 20, 50, 100, 200, 500, and 1000
- Climate scenarios available: 2030, 2050; SSP1-2.6, SSP2-4.5, SSP5-8.5
- Resolution: 30m
Note on flood hazard type Each flood hazard type (integrated, pluvial, fluvial, coastal) has its own set of return period-based flood maps from which the flood hazard curve is created. Therefore, if you wish to understand your flood risk from multiple flood hazard types, you must conduct as many risk assessments as flood hazard types of interest. If you elect to use flood hazard data provided by either FSF or Fathom, you will be limited to the flood hazard type available in their respective models.
Note on climate change Climate change can affect the flood hazard itself; therefore, for each climate scenario (e.g., a 2030 future climate under SSP2-4.5), there is a new set of return period-based flood maps from which the flood hazard curve is created. Therefore, if you wish to understand your flood risk from multiple climate scenarios, you must conduct as many risk assessments as climate scenarios of interest. For a given assessment, you can select either a present-day scenario or a future scenario. If you select a future scenario and elect to use flood hazard data provided by either FSF or Fathom, you will be limited to the climate scenarios available in their respective models.
In Iris, for 1 asset
- If conducting an assessment in Iris for a single asset, the Input Hazard tab will allow you to either manually input your own return period – flood depth pairs or lead you to a window where you can make the relevant selections to auto-populate your desired flood hazard data. When you have made the selections which best suit your assessment, click “Get Hazard.” This will call HAPI and also take you to a window where you can review and confirm your auto-populated hazard data. You can also download the .json and .csv formats of this hazard data. Once you select “Use Hazards,” you will be able to proceed to the next phase of the assessment.
In Iris, for multiple assets
- If conducting an assessment in Iris for multiple assets, you can repeat the process described above for all assets within the Iris GUI. Alternatively, if you have a large number of assets and want to auto-populate flood hazard data for all assets simultaneously, please fill out the assets’ latitudes and longitudes in the C2 template in Section 9.1 and email Jinal Mehta (Jinal.mehta@arup.com) and Tamika Bassman (Tamika.bassman@arup.com) to assist you with batching hazard data population for your asset portfolio.
Outside of Iris
- If conducting the assessment outside of Iris, please contact Jinal Mehta (Jinal.mehta@arup.com) and Stevan Gavrilovic (Stevan.gavrilovic@arup.com) to work with you to extract the hazard data you need.
Step 2: Determine FFE and obtain Flood EDP Curve
Conceptual
Before conducting a risk assessment, we must understand how a given flood depth at the building translates to a flood depth inside the building. This is more generally known as the hazard’s engineering demand parameter (EDP). To determine the flood EDP curve, we need the building finished floor elevation (FFE) relative to the same datum used to determine the flood depths at the building used in the hazard curve. The equation to adjust the flood hazard curve to the flood EDP curve is given below:
Flood depth inside the building = Flood depth at the building – FFE
Determining FFE
In a Class 2 risk assessment, it is preferable to know your building’s FFE. See below for tips to determine FFE.
- If complete drawings are available, review the Structural and/or Civil set to find the FFE (for example, “FFE=188” on first floor foundation drawings) and the exterior ground elevation (for example, contour lines showing “186” closest to the building). Calculate the difference between the two to determine how elevated the building FFE is compared to the surrounding grade (for FFE of 188ft and ground elevation of 186ft, the result would be 2ft above surrounding grade).
- It is important to note the reference datum from the drawings used to find FFE anchors the elevation vertically to a standard datum (e.g., NAVD88 typically used in the US). This datum can usually be found in the drawing notes or legend for elevations.
- To obtain ground surface elevation, there might be publicly available datasets of the ground elevation for the region of interest. Search for a regional GIS clearinghouse and see if there is publicly available elevation data (i.e., Digital Elevation Model [DEM]) that uses the same reference datum. Geospatial software (like ArcMap or ArcGIS) can convert between different reference datums. Google Earth Pro also contains elevation data that can be reviewed, noting its vertical data is WGS84 EGM96 Geoid, typically used for GIS data and not drawings. For any source, make sure the reference datum is the same between the FFE and the ground surface elevation.
- If drawings, FFE, or ground elevation are unavailable, there may be images available to estimate the FFE. Review the street view in Google Maps or any available external images of the asset. Note if there are steps at the entryways or another indication that the first floor is elevated about the surrounding grade. Use judgment to estimate the difference between the first floor and the ground.
- However, if neither drawings or adequate imagery is available and FFE is still unknown, it is reasonable to assume a default value between 0 and 1; the exact value will depend on your project / client use case. In absence of clear project direction, we recommend assuming an FFE of 0.5ft above the surrounding grade.
In Iris, for 1 asset
- If conducting an assessment in Iris for a single asset, you can input your FFE in the Input Risk Parameters step. You can also view the flood EDP curve (automatically calculated and displayed based on your asset’s flood hazard curve and FFE) and change your FFE in the Run Risk Analysis step.
In Iris, for multiple assets
- If conducting an assessment in Iris for multiple assets, you can repeat the process described above for all assets within the Iris GUI. Alternatively, if you have a large number of assets and want to auto-populate FFE data for all assets simultaneously, please fill out the FFE column in the C2 template in Section 9.1 and email Jinal Mehta (Jinal.mehta@arup.com) and Tamika Bassman (Tamika.bassman@arup.com) to assist you with batching hazard data population for your asset portfolio.
Outside of Iris
- If conducting the assessment outside of Iris, please follow the Conceptual section to determine your FFE, record it in the C2 template in Section 9.1, and contact the authors of this SOP, Jinal Mehta (Jinal.mehta@arup.com) and Meg Ackerson (meg.ackerson@arup.com) with any questions.
# Exposure
If only assessing downtime risk, move ahead to the ‘Vulnerability’ section.
If assessing repair cost risk, please follow the following steps to obtain (A) the number of floors (B) the area of the building footprint and (C) total building replacement cost, which are needed to calculate risk with respect to financial repair costs.
Step 1: Obtain relevant exposure parameters
Conceptual
Number of floors
In a C2 RA, it is recommended to use the building’s number of floors instead of a default value. If the number of floors are not provided, you can look at OpenStreetMap or Google Earth satellite imagery to estimate an approximate height category (i.e., low-, mid-, or high-rise) as a proxy for the number of floors. Please use the following table as a guideline when estimating building height category:
| Building Height (for Iris) | Number of Stories |
|---|---|
| Low-rise | 1-2 |
| Mid-rise | 3-5 |
| High-rise | >5 |
Area of the Building Footprint
In a C2 RA, it is recommended to use your building footprint area instead of a default value. If the area of the building footprint is not provided, you can look at OpenStreetMap or Google Earth satellite imagery and trace the building to estimate it (in sqft). If you are still not able to assess the area of the building footprint, you can use the archetypal default provided in the table in Appendix B1.
Building Replacement Cost
To determine the risk rating, we need to determine a % of building value damaged ratio (this is done at the end of the Risk section). To do this, you will first need to obtain the building’s replacement cost. There are 2 ways to obtain this metric.
Direct – you have the building replacement cost.
Calculate it from the total building area (in sqft) and the $/sqft cost table in Appendix B2 4
a) Building replacement cost = total building area * cost per square foot
b) Note that if you do not have the building’s total area on hand, you can calculate it from the building footprint area and the estimated number of floors of your building.
i) Total building area = building footprint area * number of floors
4 Please note that these costs are estimates and are in 2021 4th Quarter USD and based in Sacramento, CA. If your year or location is different, there may be slight differences in these values for your building.
Please follow the steps below to input or obtain your number of floors, building footprint, and building replacement cost depending on the interface you are using to conduct your risk assessment.
In Iris, for 1 asset
- Number of floors
- If you have the number of floors on hand, please input it in the Occupancy section of the Create/Edit Asset pop-up.
- If you do not have the number of floors on hand, Iris can use the archetypal number of floors when it is time to conduct the risk assessment. In this case, please leave the “Total aboveground floors” and “Total belowground floors” fields blank.
- Area of building footprint
- If you have the area of the building footprint on hand or are able to determine it from satellite imagery, please input it in the Occupancy section of the Create/Edit Asset pop-up.
- If you do not have the area of the building footprint on hand, Iris can use the archetypal footprint value when it is time to conduct the risk assessment. In this case, please leave the “Area of building footprint” field blank.
- Replacement cost
- If you have the replacement cost on hand, please input it in the Business section of the Create/Edit Asset pop-up.
- If you do not have the replacement cost on hand, Iris can calculate it using the methods described above when it is time to conduct the risk assessment. In this case, please leave the “Replacement cost” field blank.
In Iris, for multiple assets
- If conducting an assessment in Iris for multiple assets, you can repeat the process described above for all assets within the Iris GUI. Alternatively, if you have a large number of assets and want to autopopulate replacement cost, number of floors, and/or building footprint areas for all assets simultaneously, please fill out the replacement cost, number of floors, and building footprint area columns in the C2 template in Appendix A and email Jinal Mehta (Jinal.mehta@arup.com) and Tamika Bassman (Tamika.bassman@arup.com) to assist you with batching asset data population for your portfolio.
Outside of Iris
- Follow the steps in the Conceptual section above to set up your risk analysis workflow. Please contact the authors of this SOP, Jinal Mehta (Jinal.mehta@arup.com) and Meg Ackerson (meg.ackerson@arup.com) with any questions.
# Vulnerability
For flood, archetypal vulnerability curves which relate repair costs (in USD) and downtime (in days) to flood depths given in the hazard dataset need to be selected for each consequence type.
Building use type, construction type, building height category (related to number of stories), and presence of basement are required to assign the appropriate archetypal vulnerability curves to the building. See the following table for the options available within each building characteristic category.
Table 1: Table of building characteristics and their respective tags for archetype assignment
| Building Characteristic | Archetype Tag | Description |
|---|---|---|
| Use type | Residential | Single family or small multi-family (4 or fewer units) dwellings |
| Commercial Office | Office building | |
| Commercial Retail | Retail building | |
| Multi-unit Residential (MUR) | Apartment building or large multi-family (5 or greater units) dwellings | |
| Construction Type | Timber | Timber frame building |
| Non-Timber | All other building construction types, like concrete and steel | |
| Height category | Low-rise | 1-2 stories |
| Mid-rise | 3-5 stories | |
| High-rise | >5 | |
| Presence of basement | Has basement | At least one story is located below ground level |
| Does not have basement | No stories are located below ground level |
Step 1: Obtain relevant building characteristics and determine their corresponding archetype tag
- Use type – Please select the building use type from the table above that most closely resembles your building. If the building has multiple use types, please select the use of the ground floor (also called first floor herein), which would be the first one to be exposed to flood hazard.
- Construction type - The critical aspect for construction type is whether the building has a timber frame or not, because flooding can cause structural issues to timber buildings but not concrete or steel buildings. For other construction materials, judgment must be used to determine whether the structural system may be damaged by flood depth or not.
- Height category - Please select the height category which most closely matches your building’s number of stories.
- Presence of basement – If a building has a basement, significant damage is expected in the below-ground floors in the event of a flood. The archetypes with a basement provide the losses for buildings with one story below-ground. For modeling multiple basement levels, a more detailed assessment is recommended.
Step 2: Obtain vulnerability curves for each hazard and consequence pair
In total there are two vulnerability curves per archetype:
- Flood depth above FFE vs. repair cost per unit area (i.e., $/sqft)
- Flood depth above FFE vs. downtime
In Iris, for 1 asset
- After the archetype tags have been determined for all five building characteristics and input into the Assumed Building Characteristics section of the Run Risk Analysis pop-up, Iris will automatically select the appropriate archetypal vulnerability curves from the flood vulnerability curve database.
In Iris, for multiple assets
- If conducting an assessment in Iris for multiple assets, you can repeat the process described above for all assets within the Iris GUI. Alternatively, if you have a large number of assets and want to populate the appropriate assumed building characteristics in batch, please fill out the use type, construction type, height category, and basement columns in the C2 template in Appendix A and and email Jinal Mehta (Jinal.mehta@arup.com) and Tamika Bassman (Tamika.bassman@arup.com) to assist you with batching risk assessment characteristics for your portfolio.
Outside of Iris
- After the archetype tags have been determined for all four building characteristics, please select the appropriate repair cost and downtime vulnerability curves from the flood vulnerability curve database. The names of flood vulnerability archetypes are given in Appendix C3. The curves themselves are located in the Iris Resources SharePoint, under Technical Guidance and Resources, in the folder Flood Vulnerability Curves. Please contact the authors of this SOP, Jinal Mehta (Jinal.mehta@arup.com) and Meg Ackerson (meg.ackerson@arup.com) with any questions.
Step 3: Adjust archetypal vulnerability curves to your building.
If the risk analysis is for downtime consequence only, then curve adjustment is not needed, and this step can be skipped.
Now that the archetypal vulnerability curve has been determined, it must be adjusted to your building. For flood archetypes, the equation to convert the archetypal vulnerability curve (i.e., $/sqft loss vs. hazard IM) to the archetype-adjusted vulnerability curve (i.e., $ loss vs. hazard IM) is shown below.
$ loss | hazard IM = $/sqft | hazard IM * building footprint area * time factor * location factor
The building footprint area was obtained in the previous Exposure section.
The time and location factors allow the costs to be scaled based on the year of the analysis and the individual building locations, as compared to the default year and location in the archetype database. The archetype database is anchored in 2021 USD with repair cost estimates for Washington, DC, USA. Arup’s cost team should be contacted for support in determining these factors to modify the repair costs accordingly. An estimate of hours has been provided in the Overview of Risk Classes.
In Iris, for 1 asset
- Iris will automatically generate the archetype-adjusted vulnerability curve for you based on your building characteristics and the risk parameters of your assessment (i.e., time factor, location factor).
In Iris, for multiple assets
- If conducting an assessment in Iris for multiple assets, you can repeat the process described above for all assets within the Iris GUI. Alternatively, if you have a large number of assets and want to populate the appropriate assumed building characteristics in batch, please fill out the time and location factor columns in the C2 template in Section 9.1 and email Jinal Mehta (Jinal.mehta@arup.com) and Tamika Bassman (Tamika.bassman@arup.com) to assist you with batching risk assessment characteristics for your portfolio.
Outside of Iris
- Follow the process described above to covert your archetypal vulnerability curves into archetype-adjusted vulnerability curves. Please contact the authors of this SOP, Jinal Mehta (Jinal.mehta@arup.com) and Meg Ackerson (meg.ackerson@arup.com) with any questions.
# Risk Determination
Now that the hazard, exposure, and vulnerability data has been collected, the risk can be determined for a given building and all three wildfire hazard intensity measures.
Conceptual
Please see Appendix D1 Determining average annual loss (AAL) from return-period losses for a conceptual overview of going from the hazard data (i.e., hazard intensity vs. return period) and vulnerability curve selected (i.e., hazard intensity vs. consequence) to risk metrics such as average annual loss and average annual downtime.
In Iris, for 1 asset
- In the Run Risk Analysis pop-up, ensure your exposure and vulnerability inputs are correct and press “Run Risk Analysis”
- In the risk metrics output pane,
- For each flood depth, see the losses, % loss, and time to recover for each return period assessed.
- See the AAL and AAD and the corresponding qualitative risk ratings.
In Iris, for multiple assets
- If conducting an assessment in Iris for multiple assets, you can repeat the process described above for all assets within the Iris GUI. Alternatively, if you have a large number of assets and want to conduct risk assessments in batch, please email Jinal Mehta (Jinal.mehta@arup.com) and Tamika Bassman (Tamika.bassman@arup.com) to assist you with batching risk assessments for your portfolio.
Outside of Iris
- Follow the steps in the Conceptual section above to set up your risk analysis workflow. Please contact the authors of this SOP, Jinal Mehta (Jinal.mehta@arup.com) and Meg Ackerson (meg.ackerson@arup.com) with any questions.
# Iris Interface for a Class 2 Flood Risk Assessment
If running a risk assessment in Iris, this section walks through how to input the information and run a Class 2 risk assessment of a single asset through the Iris GUI.
Creating or updating an asset
Creating a risk assessment on an asset
Input Risk Parameters
Input Hazard Information
View risk metrics and optionally publish risk ratings
# Supplemental References
| Source [Location] | Link |
|---|---|
| FEMA National Flood Insurance Program (NFIP) [USA] - Flood Insurance Rate Maps (FIRMs) - Base Flood Elevation (BFE) maps - Flood Insurance Studies (FIS) | Flood Maps - FEMA.gov (opens new window) FEMA Flood Map Service Center (opens new window) |
| Fathom [Global] | Inquire internally through Ibbi Almufti |
| First Street Foundation [USA] | Inquire internally through Hedi Smida |
| ASCE/SEI 7-22 [USA] | ASCE 7 Online Hazard Tool (opens new window) |
| DEM [Global] | Google Earth Pro |
# Reference Projects
| Project Name | Job Number | Brief Description of Flood Risk Analysis (Class, Asset) | Analyst Contact(s) |
|---|---|---|---|
| IAD Cluster Resiliency Study (CRS) | Class 3 for buildings (data centers) | Meg Ackerson Adam Brooks | |
| AFO Cluster Resilience Study (CRS) | Class 3 flood risk assessments for 12 datacenters | Jinal Mehta Casie Venable | |
| Tonga Multi-Hazard Disaster Risk Assessment (MHDRA) | Class 2 for buildings (residential, commercial, health) | Meg Ackerson | |
| First Street Foundation Partnership | Class 2 for buildings (commercial office, commercial retail, multi-unit residential, single family residential) | Meg Ackerson Jinal Mehta | |
| Equity Residential | Class 1 for buildings (residential) | Kara Slocum |
# Glossary
Fluvial (riverine) – this type of flooding occurs when a river exceeds its capacity, overtops, and inundates surrounding areas.
Pluvial (surface water) – this type of flooding occurs when an extreme rainfall event exceeds surface drainage capacity, causing localized flooding
Coastal – this type of flooding occurs when extreme water levels resulting from high tides alone or the additional uplift caused by surges associated with storms cause flood waters to inundate areas next to coastlines.
HAPI – HAPI stands for Hazard Application Programming Interface. We have developed an API for users (including Iris users) to request flood hazard data. To learn more, please visit https://hapi.iris.arup.com/docs#/.
# Appendix
# Appendix A - Data Collection Templates
Class 1 template: Flood C1 RA Vulnerability Data Template v2.xlsx
Class 2 template: Flood C2 RA Vulnerability Data Template v2.xlsx
# Appendix B - Exposure
# Appendix B1 - Archetypal footprint area (sqft)
| Building Archetype | Footprint Area (sqft) | Building Archetype | Footprint Area (sqft) | Building Archetype | Footprint Area (sqft) |
|---|---|---|---|---|---|
| off_low_t_b | 3000 | com_low_t_b | 3000 | mur_low_t_b | 3000 |
| off_low_t_nb | 3000 | com_low_t_nb | 3000 | mur_low_t_nb | 3000 |
| off_low_nt_b | 3000 | com_low_nt_b | 3000 | mur_low_nt_b | 3000 |
| off_low_nt_nb | 3000 | com_low_nt_nb | 3000 | mur_low_nt_nb | 3000 |
| off_mid_t_b | 10000 | com_mid_t_b | 10000 | mur_mid_t_b | 10000 |
| off_mid_t_nb | 10000 | com_mid_t_nb | 10000 | mur_mid_t_nb | 10000 |
| off_mid_nt_b | 10000 | com_mid_nt_b | 10000 | mur_mid_nt_b | 10000 |
| off_mid_nt_nb | 10000 | com_mid_nt_nb | 10000 | mur_mid_nt_nb | 10000 |
| off_high_nt_b | 15000 | com_high_nt_b | 15000 | mur_high_nt_b | 15000 |
| off_high_nt_nb | 15000 | com_high_nt_nb | 15000 | mur_high_nt_nb | 15000 |
| Building Archetype | Footprint Area (sqft) | Building Archetype | Footprint Area (sqft) |
|---|---|---|---|
| resi_su_low_t_b | 1000 | resi_mu_low_t_b | 1300 |
| resi_su_low_t_nb | 1500 | resi_mu_low_t_nb | 2000 |
| resi_su_low_nt_b | 1000 | resi_mu_low_nt_b | 1300 |
| resi_su_low_nt_nb | 1500 | resi_mu_low_nt_nb | 2000 |
| resi_su_mid_t_b | 600 | resi_mu_mid_t_b | 1000 |
| resi_su_mid_t_nb | 700 | resi_mu_mid_t_nb | 1200 |
| resi_su_mid_nt_b | 600 | resi_mu_mid_nt_b | 1000 |
| resi_su_mid_nt_nb | 700 | resi_mu_mid_nt_nb | 1200 |
# Appendix B2 - $/SF costs for residential, commercial, and industrial building types
| Type | Stories | Description | $/SF |
|---|---|---|---|
| Residential - Single Family House | 2 Stories | $340 | |
| Residential - High Rise | 8-24 Stories | Precast concrete / Reinforced | $470 |
| Residential - Medium Rise | 4-7 Stories | Precast concrete / Reinforced | $410 |
| Residential - Low Rise | 1-3 Stories | Stone Veneer / Wood Frame | $380 |
| Commercial - Office | 1-20 Stories | Office, with Brick Veneer / Reinforced Concrete | $440 |
| Commercial - Restaurant, bakery, Bar, Nightclub | 1 Story | Restaurant with Brick Veneer / Wood Frame | $420 |
| Commercial - Retail, Dept Stores etc. | 1 Story | Store, Retail with Brick Veneer / Reinforced Concrete | $330 |
| Commercial - Convenience Store | 1 Story | Store, Convenience with Face Brick / Wood Frame | $280 |
| Commercial - Hotel High Rise | 8-24 Stories | Hotel, 8-24 Story with Precast Concrete / Reinforced Concrete | $440 |
| Commercial - Hotel Medium Rise | 4-7 Stories | Hotel, 4-7 Story with Precast Concrete / Reinforced Concrete | $400 |
| Commercial - Motel | 2-3 Stories | Motel, 2-3 Story with Stucco & Concrete Block / Wood Joists | $370 |
| Commercial - Supermarket | 1 Story | Supermarket with Brick Veneer / Reinforced Concrete | $320 |
| Commercial - Carwash | 1 Story | Car Wash with Concrete Block / Bearing Walls | $600 |
| Commercial - Parking Structure | 5 Story | Garage, Parking with Cast in Place Concrete / Reinforced Concrete | $190 |
| Commercial - Laundromat | 1 Story | Laundromat with Decorative Concrete Block / Bearing Walls | $480 |
| Commercial - Veterinary hospital | 1 Story | Veterinary Hospital with Brick Veneer / Wood Truss | $360 |
| Industrial | 1 Story | Warehouse | $380 |
Key Assumptions
All costs are in 2021 4th Quarter USD.
Location: Sacramento, CA.
Sources: RSMeans and other internal project data
# Appendix C - Vulnerability
# Appendix C1 - Building characteristics and their respective tags for archetype assignment
| Building Characteristics | Description | Archetype Tag |
|---|---|---|
| Usage | Residential | RES |
| Commercial | COM | |
| Industrial | IND | |
| Wall Material | High ignition potential, combustible material wall | HCW |
| Low ignition potential, combustible material wall | LCW | |
| Noncombustible material wall | NCW | |
| Roof Material | High ignition potential, combustible material roof | NCW |
| Low ignition potential, combustible material roof | LCR | |
| Noncombustible material roof | NCR | |
| Compliance with applicable WUI or wildfire codes, standards, or guides | Built before WUI/wildfire code was adopted or not compliant with applicable WUI or wildfire codes, standards, and guides | BC |
| Built after WUI/wildfire code was adopted or compliant with applicable WUI or wildfire codes, standards, and guides | AC | |
| Defensible space | No defensible space within 50ft | ND |
| High defensible space within 50ft | HD |
# Appendix C2 - List of flood vulnerability curves
| Flood Building Archetypes | ||||
|---|---|---|---|---|
| off_low_t_b | com_low_t_b | mur_low_t_b | resi_su_low_t_b | resi_mu_low_t_b |
| off_low_t_nb | com_low_t_nb | mur_low_t_nb | resi_su_low_t_nb | resi_mu_low_t_nb |
| off_low_nt_b | com_low_nt_b | mur_low_nt_b | resi_su_low_nt_b | resi_mu_low_nt_b |
| off_low_nt_nb | com_low_nt_nb | mur_low_nt_nb | resi_su_low_nt_nb | resi_mu_low_nt_nb |
| off_mid_t_b | com_mid_t_b | mur_mid_t_b | resi_su_mid_t_b | resi_mu_mid_t_b |
| off_mid_t_nb | com_mid_t_nb | mur_mid_t_nb | resi_su_mid_t_nb | resi_mu_mid_t_nb |
| off_mid_nt_b | com_mid_nt_b | mur_mid_nt_b | resi_su_mid_nt_b | resi_mu_mid_nt_b |
| off_mid_nt_nb | com_mid_nt_nb | mur_mid_nt_nb | resi_su_mid_nt_nb | resi_mu_mid_nt_nb |
| off_high_nt_b | com_high_nt_b | mur_high_nt_b | ||
| off_high_nt_nb | com_high_nt_nb | mur_high_nt_nb |
# Appendix D - Risk
# Appendix D1 - Determining Average Annual Loss (AAL) from return period losses
Step 1: For each consequence of interest, get estimated loss for each return period – flood depth pair.
- For each return period, determine the hazard value from the hazard curve (return period vs. hazard) and look up the corresponding loss value from the vulnerability curve (hazard vs. loss)
Step 2: For each consequence of interest, get average annual loss from the return period losses.
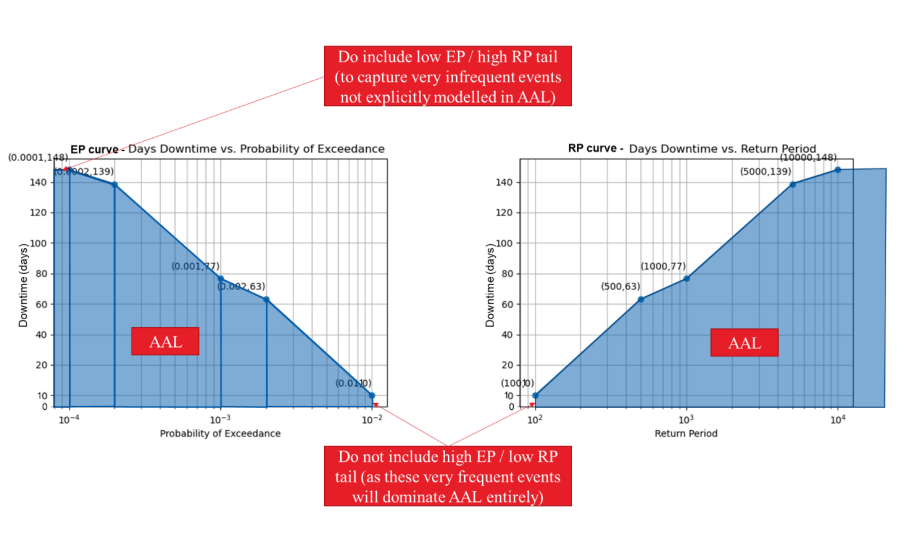
To get the average annual loss (AAL), calculate the area under the return period vs. loss curve, mathematically represented by the following equation:

where r = return period, L = consequence of interest, and Fe = exceedance probability (F_e=1/r).
In practice, there are several ways to approximate this integral from discrete return period losses.
Iris uses trapezoidal integration under the exceedance probability vs. consequence curve, with an inclusion of upper tail losses and exclusion of lower tail losses (as shown in the figure below). The exact method of estimating the area under the curve and whether to include upper tail and/or lower tail losses will depend on the project / client use case. In absence of a clear project direction, we recommend using the same assumptions as Iris for your off-platform calculations.
Step 3: Use the AAL to qualitative risk rating tables in the Risk Matrices spreadsheet (linked in Section 9.) to determine the corresponding qualitative ratings for your building’s AALs for each consequence assessed (e.g., AAL, AAD)
- First, determine your client’s risk appetite – risk tolerant, risk neutral, or risk averse. If you do not know your client’s risk appetite, assume your client is risk neutral.
- For each consequence considered, select the appropriate risk matrix for your client’s risk appetite. The risk matrices for all risk appetites and consequences of interest are located at the following SharePoint link: Risk Matrices.xlsx
- Based on your calculated AAL or AAD, determine your risk rating.
AAL to Risk Rating Matrices Link to shared location (view-only): Risk Matrices.xlsx