# Earthquake SOP
Last updated March 13, 2023 by K. Buyco
# Scope
- Hazard: Earthquake Shaking
- Asset types: Buildings
- Consequences: Downtime, Repair Cost
- Region: USA
# Introduction
Earthquake shaking occurs when a fault ruptures and seismic waves propagate through the earth. In each earthquake event, the shaking will generally be more intense closer to the rupturing fault, with the intensity dissipating as the seismic waves propagate away from the fault. Lateral acceleration transferred from the ground motion to the building superstructure causes the building to experience excess lateral loading and story drifts beyond the design capacity of the structure, ultimately leading to damage or even collapse.
# Overview of Risk Classes
| Description | Class 1 | Class 2 | Class 3/4 |
|---|---|---|---|
| Hazard data | 475-year Peak Ground Acceleration (PGA) PGA at other return periods if needed | 475-year Peak Ground Acceleration (PGA) Site Class PGA at other return periods if needed | Site-specific probabilistic seismic hazard modeling considering site classification and fault source |
| Exposure data | Construction year (before/after 1940) Building location (lat/long) Generic construction type Building occupant type | Construction year (before/after 1940) Building location (lat/long) Detailed construction type and structural system Building occupant type Number of stories FEMA P154 score (if life safety assessment is needed) Presence of horizontal/vertical irregularities* (if life safety assessment is needed) Has been retrofitted or not* (if life safety assessment is needed) | Quantities of structural and non-structural components Fragilities (damage state and repair time) of components Construction year Building location Detailed construction type and structural system Building occupant type Number of stories FEMA P154 score (if life safety assessment is needed) Presence of horizontal/vertical irregularities* (if life safety assessment is needed) Has been retrofitted or not* (if life safety assessment is needed) |
| Level of effort needed | 15 minutes to extract USGS hazard curves 45 minutes to apply exposure modifiers and extract downtime and repair cost outputs | Same as class 1, additional 30 minutes allotted to reviewing drawings and specifications, additional hour allotted for life safety evaluation | Highly project-specific. Hazard modeling dependent on availability of site ground motions, engineering demand parameters Exposure modeling dependent on number of components and availability of component information Allow at minimum 8 hours each for extracting information and initial hazard and exposure modeling, 1 hour for seismic engine to run, and 4 hours for post-processing seismic engine outputs. |
| Output | Qualitative risk ratings for downtime and repair cost | Quantitative risk metrics and qualitative risk ratings for downtime and repair cost | Quantitative risk metrics and qualitative risk ratings for downtime and repair cost Component drivers of risk |
*Assumption provided if unknown.
# Class 1 Assessment
# 1. Downtime and Repair Cost
Follow the steps outlined in this section to obtain downtime and repair cost as portion of total building replacement cost for seismic risk analysis of buildings. This process will assign a vulnerability archetype to the building based on construction and occupancy characteristics. Curves are associated with each archetype. The hazard data for each site, the building exposure information, and the vulnerability curves will be combined to produce risk results for this Class 1 assessment.
# 1.1 Data Collection
Follow Steps 1 through 4 to collect exposure, vulnerability, and hazard information necessary to carry out the analysis in Steps 5 through 8.
# Exposure and Vulnerability
Very limited site information is expected to be available for conducting Class 1 analyses. Follow these steps to collect required building information for the exposure and vulnerability analyses. Since detailed footprint and replacement values may not readily be available, the monetary losses are provided as a percentage value with respect to the total replacement cost of an asset rather than absolute loss value. The methodology employed in this operating procedure is adapted from FEMA Hazus 4.2.
Step 1: Collect Building Location Data
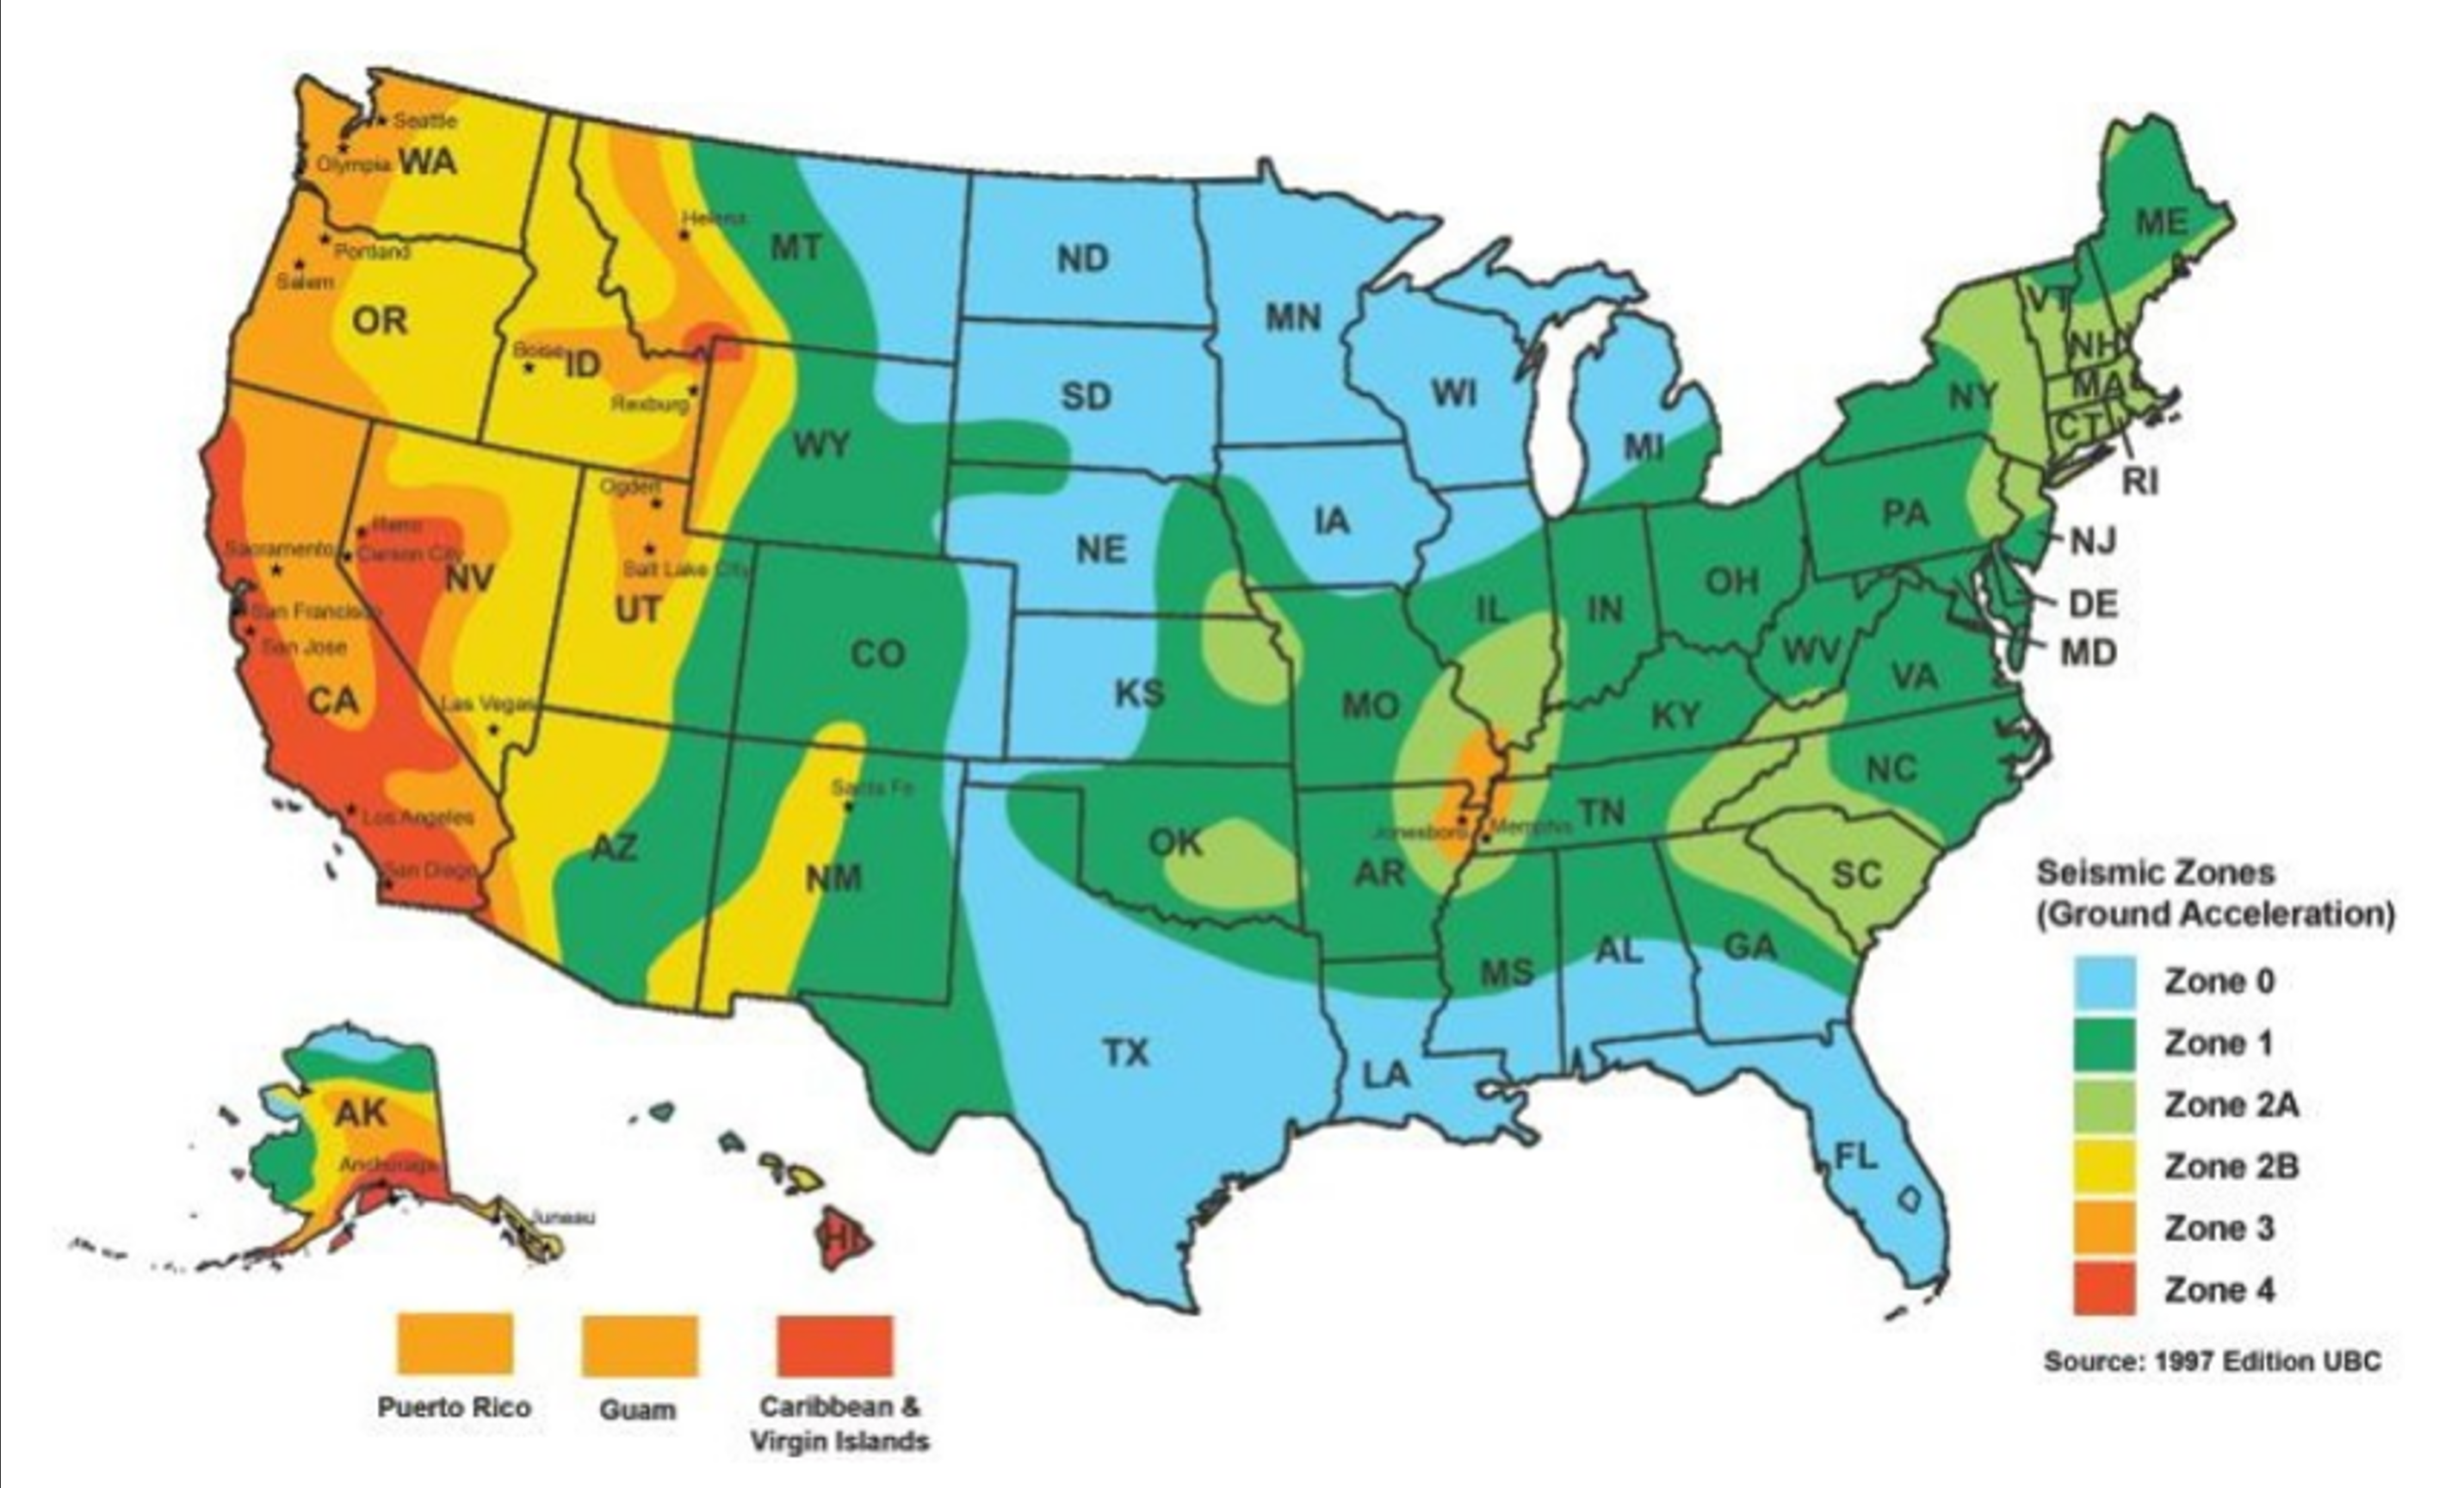
Building latitude and longitude is required to determine the seismic region of the site per Figure 1 below.
Figure 1. United States seismic zones, per Uniform Building Code
Step 2: Collect Building Construction Information
Determine the construction year of the building, and the type of the building as one of the following: Wood, Steel, Concrete. This information may come from drawing sets, online tax assessor records, or directly from clients. For Class 1 assessment, assumptions on the structural system and story height as shown in the table below are applied when assessing the vulnerabilities of a building. If further information on building structural system is available, please refer to Class 2 section for more detailed structural system breakdowns and associated thresholds.
Assumed structural system and story height of buildings for Class 1 assessments
| Assumed structural system | Assumed story height | |
|---|---|---|
| Wood | Light wood frame | Mid-height (3-7 stories) |
| Steel | Steel light frame | Same as above |
| Concrete | Concrete moment frame | Same as above |
Step 3: Collect Building Occupancy Information
Determine the occupancy type of the building as one of the following: Single-Family Dwelling, Multi-Family Dwelling, Commercial, Industrial (typical and high technology), and Other.
# Hazard
The main hazard inputs required to conduct risk assessments are the site class and peak ground acceleration (PGA). The site class determines the average shear-wave velocity to a depth of 30 meters (Vs30). Since it is expected that site class may not be readily available for a Class 1 analysis, default settings may be applied through the USGS unified hazard tool (opens new window).
Step 4: Collect Peak Ground Acceleration at Building Site
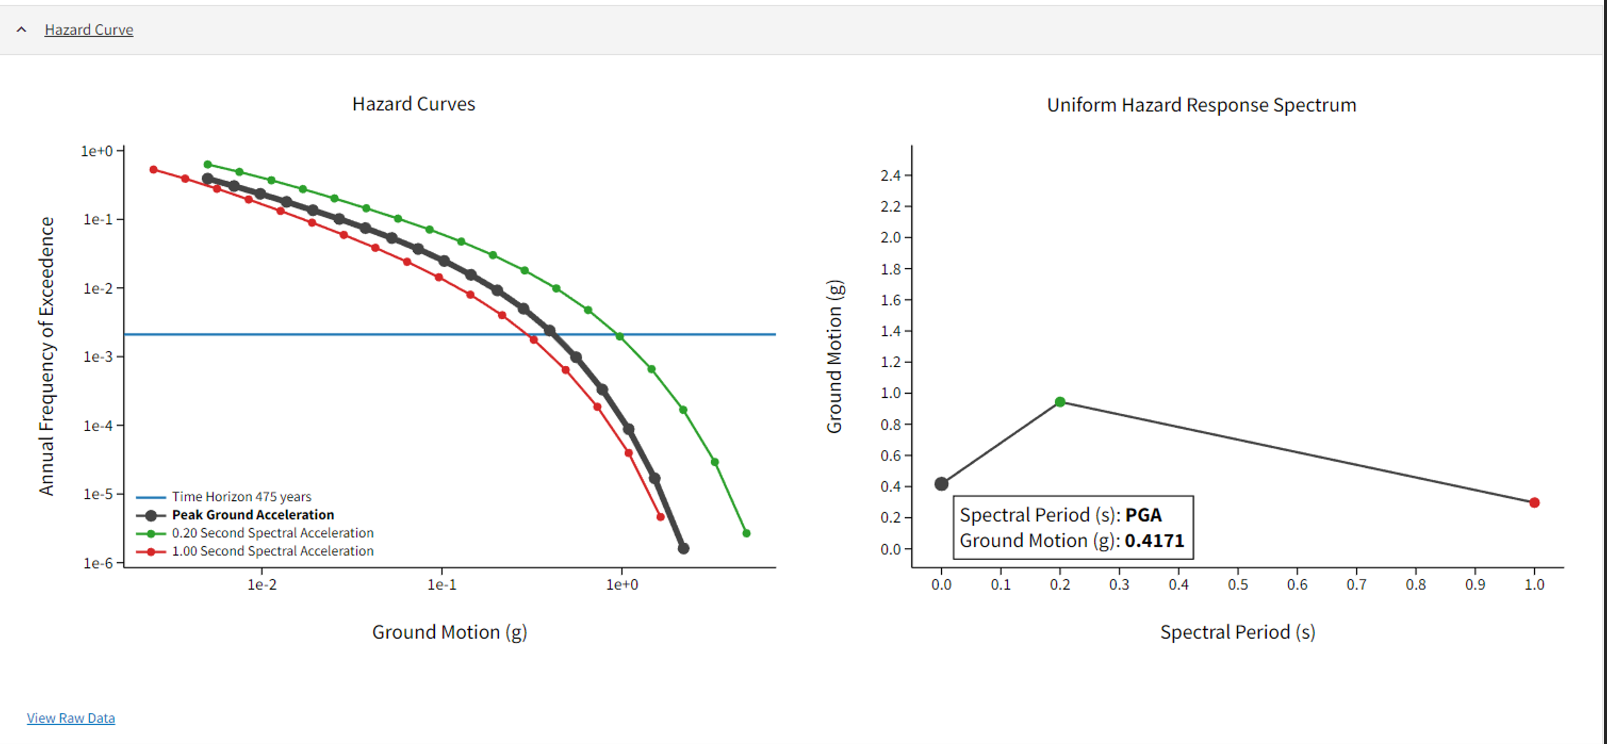
Input the latitude and longitude of the building address into the USGS unified hazard tool (opens new window), setting site class to default. Extract the 475-year PGA value for the site. See Figure 2 below for screenshot displaying example inputs with sample location, 475-year return period, and default B/C boundary site class. See Figure 3 below for screenshot displaying example output page and desired 475-year PGA value in the uniform hazard response spectrum plot to the right. Alternative return periods may be referenced if additional return-period PGA values are required for a project.
Figure 2. Sample input page for the USGS unified hazard tool using default site class setting of B/C boundary for a return period of 475 years.
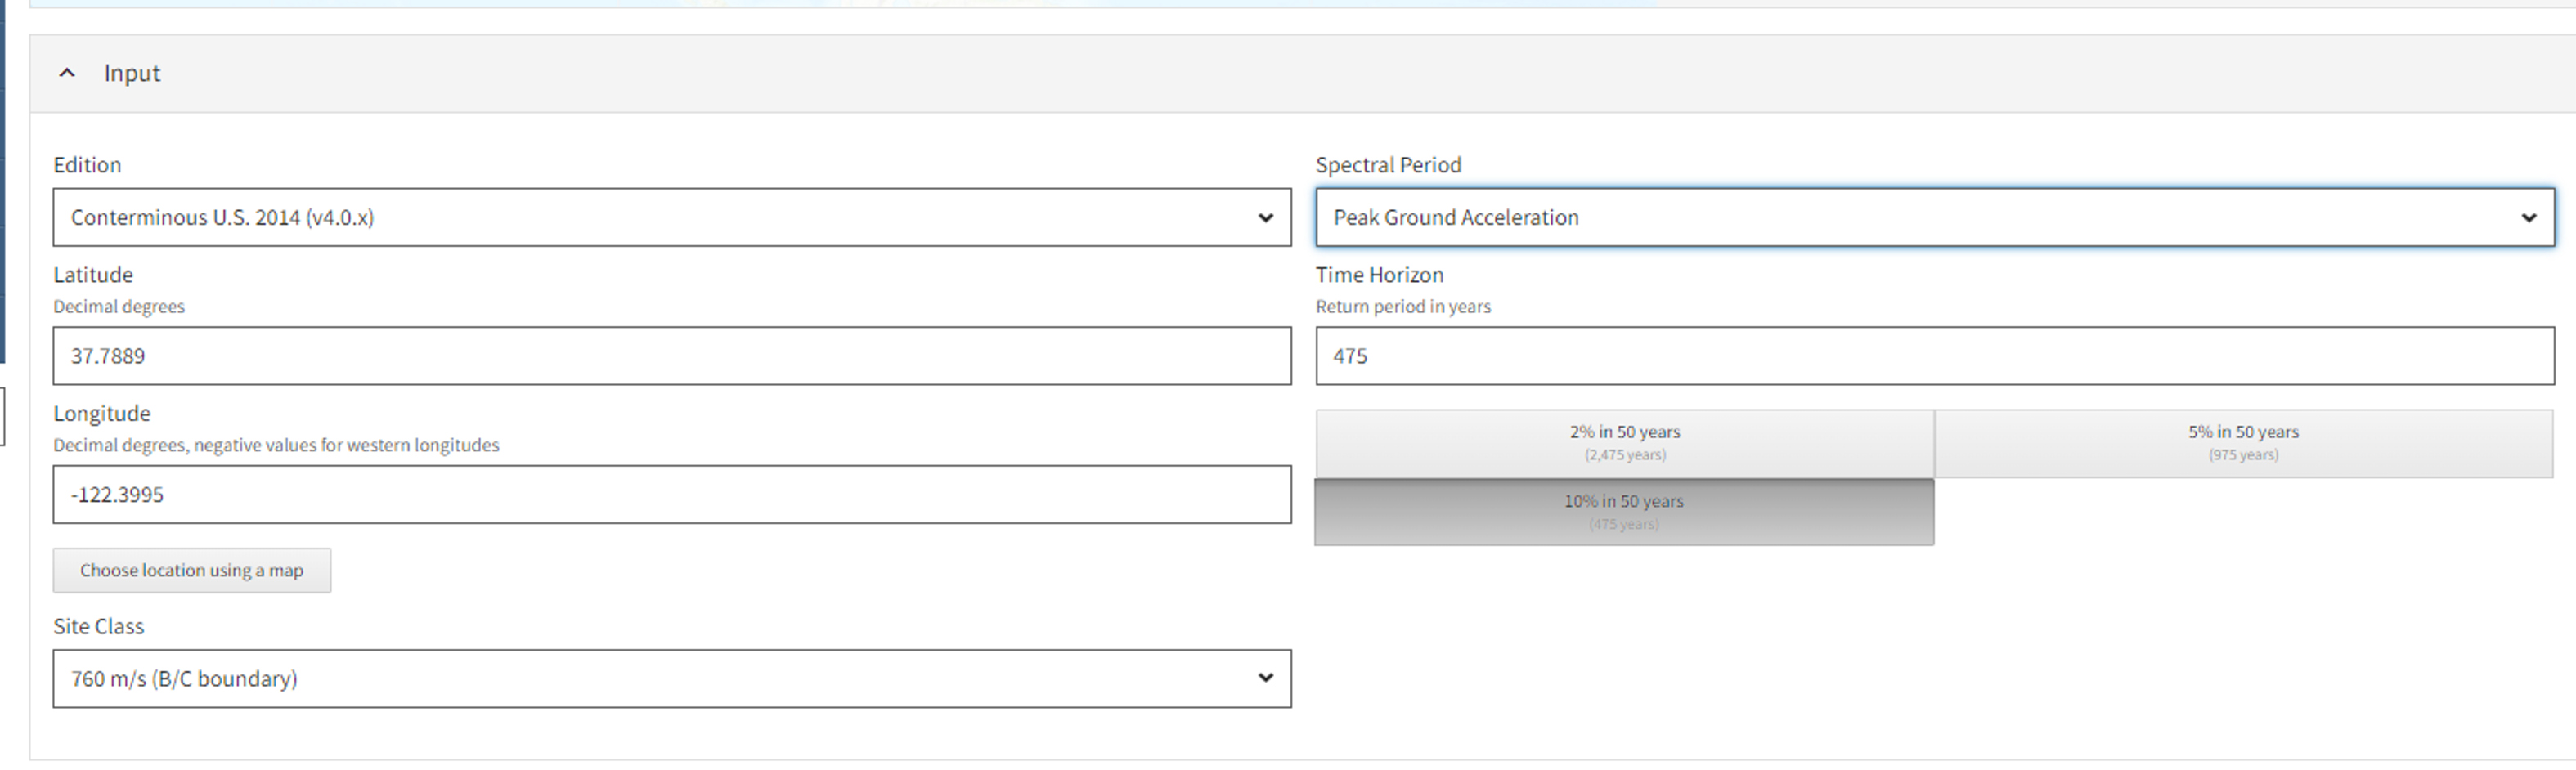
Figure 3. Sample output page for the USGS unified hazard tool. Note Uniform Hazard Response Spectrum plot on right and 0.4171g PGA value associated with the 475-year return period.
# 1.2 Analysis
With the building data collected in Steps 1 through 3 and the hazard data collected in Step 4, the downtime and loss risk ratings may be determined as follows:
Step 5: Assign Code Modifier to Building
Using seismic zone obtained in Step 1, assign code modifier per table below to building per the table below. Assets in Seismic Zone 4 are assigned High Code modifiers, and assets in Zones 1 and lower are assigned Low Code modifiers. Other assets are Moderate Code by default. Using the construction year obtained in Step 2, assign the Low Code modifier to the asset if its construction year is before 1940.
Modifiers based on building code and construction year
| Code Era | Seismic Zone | Modifier |
|---|---|---|
| High Code | Seismic Zone 4 | 1.443 |
| Moderate Code | Seismic Zone 2A, 2B, and 3 | 1 |
| Low Code* | Seismic Zone 0 and 1 | 0.71 |
* Assign low code modifier regardless of seismic zone if built before 1940.
Step 6: Apply Code Modifier to PGA Thresholds and Obtan Expected Damage State
Reference the below table and extract PGA capacity values based on the construction type determined in Step 2. These capacity values, when exceeded, signal the building sustaining its associated damage state. Apply code modifiers determined in Step 5 to PGA column (i.e., multiply the PGA threshold values by the code modifier). Then using the PGA values obtained in Step 4, determine the expected damage state based on PGA thresholds exceeded (e.g., 475-year PGA of 0.4171g exceeds 0.39g*1 for a Moderate Code Wood Light Frame Mid-Rise, and thus is expected to incur the moderate damage state for a 475-year event).
PGA thresholds for damage states by construction type
| Construction Type | Peak Ground Acceleration (g) | Damage State |
|---|---|---|
| Wood | 0.22 | Slight |
| 0.39 | Moderate | |
| 0.78 | Extensive | |
| 1.24 | Complete | |
| Steel | 0.13 | Slight |
| 0.19 | Moderate | |
| 0.33 | Extensive | |
| 0.6 | Complete | |
| Concrete | 0.13 | Slight |
| 0.21 | Moderate | |
| 0.44 | Extensive | |
| 0.8 | Complete |
Step 7: Based on Expected Damage State and Occupancy Type, Determine Downtime and Loss
Reference damage state obtained in Step 6 and extract downtime and loss values based on residential occupancy type obtained in Step 3.
Asset downtime and Loss as % of complete building replacement cost based on damage state and occupancy type
| Occupancy Type | Damage State | Full Recovery (Financing, Inspections, etc.) in Days | Loss as % of Replacement Cost |
|---|---|---|---|
| Single-Family Dwelling | Slight | 5 | 2 |
| Moderate | 120 | 10 | |
| Extensive | 360 | 45 | |
| Complete | 720 | 100 | |
| Multi-Family Dwelling | Slight | 10 | 2 |
| Moderate | 120 | 10 | |
| Extensive | 480 | 41 | |
| Complete | 960 | 100 | |
| Mixed Use | Slight | 10 | 2 |
| Moderate | 90 | 10 | |
| Extensive | 270 | 44 | |
| Complete | 360 | 100 | |
| Commercial | Slight | 10 | 2 |
| Moderate | 90 | 10 | |
| Extensive | 270 | 40 | |
| Complete | 360 | 100 | |
| Industrial (typical) | Slight | 10 | 2 |
| Moderate | 90 | 10 | |
| Extensive | 240 | 36 | |
| Complete | 360 | 100 | |
| Industrial (high technology) | Slight | 20 | 2 |
| Moderate | 135 | 10 | |
| Extensive | 360 | 36 | |
| Complete | 540 | 100 | |
| Other | Slight | 8 | 2 |
| Moderate | 75 | 10 | |
| Extensive | 460 | 40 | |
| Complete | 720 | 100 |
Step 8: Translate Quantitative Downtime and Loss Metrics to Qualitative Risk Rating
Given the return period used for the assessment (475-year or otherwise as required by project) and the associated downtime and repair cost as obtained in Step 7, input the return period, downtime, and repair cost into Iris to translate and obtain qualitative risk ratings for risk neutral, risk averse, or risk tolerant propensities. [to be updated in future when Iris is updated for seismic].
# 2. Life Safety
Life safety vulnerability calculations draw from the FEMA P-154 rapid visual screening (RVS) scoring system, which is typically used to assess the seismic collapse risk of structures using visual inspection and/or drawing review. As detailed building parameters as well as FEMA P-154 score are not expected to be available for a Class 1 analysis, simplified Class 1 life safety assessments is not yet applicable. An alternative method for conducting Class 1 analyses will be published shortly following in-house development of archetype fragility curves in 2023.
# Class 2 Assessment
# 1. (Consequence)
# 1.1 Data Collection
# Exposure and Vulnerability
Step 1: Collect Building Location Data
Step 2: ...
Step 3: ...
Step 4: ...
Step 5: ...
Step 6: ...
# Hazard
Step 7: Obtain Hazard Data
# 1.2 Analysis
# Iris Interface
...holding off on including the rest until the workflow is closer to finalized.
# Supplemental References
| Source [Location] | Link |
|---|---|
| FEMA P-154, 3rd edition (up to date as of July 2022; handbook) | FEMA P-154 (opens new window) |
| FEMA P-155, 3rd edition (up to date as of July 2022; supporting documentation for P-154) | FEMA P-155 (opens new window) |
| FEMA P-154 data collection forms, 3rd edition (up to date as of July 2022) | FEMA P-154 Data Collection Forms (opens new window) |
| ASCE/SEI 7-22 [USA] | ASCE 7 Online Hazard Tool (opens new window) |
| USGS Unified Hazard Tool [USA] | USGS Unified Hazard Tool (opens new window) |
| Earthquake Life Safety Spreadsheet | Internal Spreadsheet Tool (opens new window) |
| FEMA Hazus 4.2 Earthquake Technical Manual | Hazus (opens new window) |
# Reference Projects
This methodology has been employed in the EQR Portfolio Resilience project, and numerous confidential datacenter pre-due diligence site screening studies.
| Project Name | Job Number | Brief Description of Flood Risk Analysis (Class, Asset) | Analyst Contact(s) |
|---|
# Glossary
...to be added...
# Appendix
...to be added...