# Wind SOP
Last updated June 22, 2023 by S. Meng
# Scope
Hazard: Non-tornadic wind
Asset types: Buildings
Consequences: Downtime, Repair cost
Region: Global
# Introduction
Non-tornadic winds can be damaging to buildings. Different types and mechanisms of non-tornadic wind, such as tropical cyclones (called hurricanes or typhoons in certain regions of the world), thunderstorm downdrafts, micro/macro bursts, and extra tropical depressions, can cause damage.
A damaging wind event can result in high gust wind speeds, which can damage the building envelope, consisting of exposed equipment, roof cover, windows, and doors. An extremely damaging wind event can even result in structural failure. Additionally, debris can be picked up and generated, which can impact the building envelope and cause damage. High wind events are often accompanied by a large rain event, such as a hurricane. In this case, significant water ingress damage could happen when the building envelope is breached. In all these cases, wind events can cause substantial damage and significant consequences like financial loss and downtime.
Tornadic wind has a unique wind mechanism and is not covered under this hazard. A separate tornadic wind section will be provided
# Overview of risk classes
| Description | Class 1 | Class 2 | Class 3/4 |
|---|---|---|---|
| Hazard data | Wind hazard data (return period vs open terrain 3s gust). For U.S., data is available from ASCE 7-22 | Wind hazard data (return period vs open terrain 3s gust). For U.S., data is available from ASCE 7-22 | Site-specific wind hazard data from site specific wind hazard modeling considering terrain and directionality effect |
| Exposure Data | Building use type Surrounding terrain category Building footprint area* Building replacement value* Latitude, longitude Time factor* Location factor* | Building use type Number of stories above ground Building area Building replacement value Latitude, longitude Roof construction type Design wind zone Missile environment Surrounding terrain category Time factor Location factor | Quantities, locations, and anchorage quality of building components, including envelope components, structural members, MEP equipment, and contents Building use type Number of stories above ground Building area Building replacement value Latitude, longitude Time factor Location factor |
| Time to set up project | Allocate 8hrs for project set-up in Iris | Allocate 8hrs for project set-up in Iris | Allocate 8hrs for project set-up in Iris |
| Time required to review and input exposure data | Assume data has been collected (add time estimate to proposal) Less than 50 sites: 30 min per site More than 50 sites: 15 minutes per site (assuming input into Iris is automated) | Assume data has been collected (add time estimate to proposal) Less than 50 sites: 90 min per site More than 50 sites: 60 minutes per site (assuming input into Iris is automated) | Assume data has been collected (add time estimate to proposal) Any number of sites: 4 hours per site |
| Time required to review or obtain cost data (location & time factors, replacement value) | Allow 8hrs for cost team to provide regional location factors, appropriate time factor, and replacement value ($/sf) for 2-3 building types | Allow 8hrs for cost team to provide regional location factors, appropriate time factor, and replacement value ($/sf) for 2-3 building types | Allow 4hrs for cost team to provide regional location factors and appropriate time factor If replacement value provided by client, allow 2-3hrs for review of values by cost team. If replacement value not provided by client, allow 6-8hrs for cost team to provide replacement value ($/sf) for every 2-3 building types |
| Time required to review hazard data and QA/QC risk results | Allocate nominal time for spot checks | Allocate 60 min per site | Allocate 8 hours per site |
| Output | Qualitative risk ratings (e.g., High, Medium, Low) | Quantitative risk metrics (AAD, AAL) Qualitative risk ratings (e.g., High, Medium, Low) | Component drivers of risk Quantitative risk metrics (AAD, AAL) Qualitative risk ratings (e.g., High, Medium, Low) |
*Assumption provided if unknown or if not developed yet.
# Class 1 Assessment
# 1. Downtime and Repair Cost
Follow the steps outlined in this section to obtain downtime and repair cost risk rating for Class 1 wind risk analysis of buildings. This process will assign a vulnerability archetype to the building. Two vulnerability curves are associated with each archetype:
- Wind speed-loss curve, which relates repair costs (in USD) to wind speed
- Wind speed-downtime curve, which relates downtime (in days) to wind speed The hazard data for each site, the building exposure information, and the vulnerability curves will be combined to produce risk results for this Class 1 Assessment.
# 1.1 Data Collection
Collect all required input data before putting into Iris. The data is best collected into a spreadsheet; see the Class 1 template linked in the Appendix.
Exposure and Vulnerability
Very limited site information is expected to be available for conducting Class 1 analyses. Follow these steps to collect required building information for the exposure and vulnerability analyses. The data can be input via the provided template.
Step 1: Collect Building Location Data
The building location should be determined as the centroid of the building footprint and provided as a latitude and longitude in degrees.
Step 2: Building Occupancy Type
It is assumed that the building occupancy type is known. Each building occupancy type maps to one of four archetypes for a Class 1 assessment, as described by the assumptions in the table below.
Class 1 assessments do not allow you to modify the input parameters. If modifying input parameters is of interest, then it is suggested to do a Class 2 analysis.
| Analysis Assumption | Residential | Industrial | Data Center | Commercial |
|---|---|---|---|---|
| Building occupancy type (options in Iris) | Residential | Factory Fulfillment Gym Mill Parking Utility Substation Warehouse | Datacenter | Academic Administrative Auditorium Childcare Data Center Daycare Dining Distribution Emergency Services Government Healthcare Hospitality Laboratory Library Museum Office R&D Retail Special Laboratory Sports Venue Theater Unknown |
| Building archetype use type (assumed) | Multi-family residential Industrial - General | Industrial - Datacenter | Commercial -General | |
| Building height (assumed) | Midrise (3-7 stories, with 10’ average story height) | Lowrise (1-2 stories, with 20’ average story height) | ||
| Roof construction type | Concrete | Built-up roof | Built-up roof | Concrete |
| Design wind zone | Medium | Medium | Medium | Medium |
| Building replacement value ($/sqft) | $257/sq ft | $189/sq ft | NEED TO GET THIS VALUE | $285/sq ft |
| Missile env | High | High | High |
Step 3: General Surrounding Terrain Type
The surrounding terrain condition could affect the wind speed when it approaches the building. An open terrain condition could result into a higher local wind speed where the building component will see compared to a terrain where many other buildings are around in an urban dense area. Based on the building surrounding from satellite view, the analyst needs to select one of the general terrain types for the assessment as suggested in the table below. For each terrain type, the input hazard which is supposed to be the open terrain wind speed will be adjusted for the local terrain location with pre-defined wind speed adjustment factor.
| ASCFE Exposure Category | Description | Wind Speed Adjustment Factor |
|---|---|---|
| Urban and Suburban Residential (Type B) | Urban and suburban areas, wooded areas, or other terrain with numerous, closely spaced obstructions that have the size of single-family dwellings or larger. 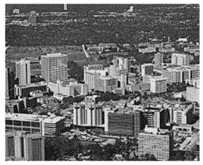 | Building less than 4 stories (<40 ft), use 0.8*; Between 4-12 stories (40-120 ft), use 1; Between 12-25 stories (120-250 ft), use 1.2; Greater than 25 stories (>250 ft), use 1.4 |
| Open terrain with scatter obstructions (Type C) | Open Country, Grassland, flat open field. 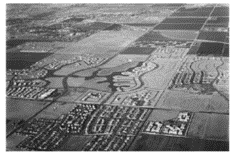 | Building less than 4 stories (< 40 ft), use 1; Between 4-8 stories (40-80 ft), use 1.2; Between 8-18 stories, (80-180 ft), use 1.4; Greater than 18 stories (> 180 ft), use 1.6 |
| Unobstructed are and water surface (Type D) | Flat, unobstructed areas and water surfaces. 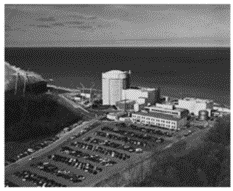 | Building less than 4 stories (< 40 ft), use 1.1; Between 4-8 stories (40-80 ft), use 1.3; Between 8-18 stories (80-180 ft), use 1.5; Greater than 18 stories (>180 ft), use 1.7 |
*For US site, use 0.7 if the risk result using 0.8 is deemed too high
Step 4: Building Replacement Value (optional)
Replacement value is the cost to replace the building if it were completely damaged, which includes the demolition and removal of the old structure and the design and construction of the new structure. To note, the replacement value is not the same as the building value or the insured value.
The client should provide this information for each asset. If the replacement value is unknown, Arup’s cost team can support and develop an estimate based on the building use type and size.
The replacement value should be provided in present-day US dollars.
If the info is not available, the default replacement value can be used as summarized in the archetype table above.
Step 5: Building Footprint Area (optional)
If the Class 1 analysis is for downtime consequence only, then the building footprint area is not needed, and this step can be skipped.
The building footprint area is the same as the area of the ground floor of the building. There are several ways to obtain or estimate this property.
If the client provides the total building area and the number of stories, the footprint can be assumed to be the quotient of building area divided by number of stories.
If the project is not time constrained, the footprint can be measured using geospatial tools in Google Earth Pro, ArcMap, or other software. Using satellite view, the outline of the building can be traced and the area within it can be estimated.
If the building footprint area is not provided and cannot easily be determined within the constraints of the project, then default footprint areas can be used as summarized in the archetype table below.
Step 6: Time and Location Factors (optional)
If the Class 1 analysis is for downtime consequence only, then the time and location factors are not needed, and this step can be skipped.
The time and location factors allow the costs to be scaled based on the year of the analysis and the individual building locations, as compared to the default year and location in the archetype database. The archetype database is anchored in 2022 USD with repair cost estimates for Washington, DC, USA. Arup’s cost team should be contacted for support in determining these factors to modify the repair costs accordingly. An estimate of hours has been provided in the Overview of Risk Classes. If no factors are provided, default factor of 1.0 will be used.
Hazard
The main hazard input required to conduct the wind risk assessment is the 3s-gust wind speed. The location of the asset needs to be known to obtain the hazard data. The 3s-gust wind speed at multiple return periods is typically needed.
Step 6: Obtain Hazard Data
For US-based sites (including Puerto Rico):
The wind hazard can be obtained from the ASCE 7 online tool as shown in the figures below. Users need to first put the address or latitude/longitude coordinate of the site in the home page of the tool (see circled location in Figure 1 below). After the site is located, select ASCE 7-22 code version and Risk Category II as shown Figure 2 below. Then after clicking the “View Results” button, the wind speed at various return period of the site could be seen by viewing the “Summary” sheet as shown in Figures 3 and 4 below.
If you or your client want to customize the wind hazard because you have location-specific wind hazard results for your asset, you can input customized data for return periods of your or your client's choice. Ideally multiple return periods are needed for the hazard input.
For non-US-based sites:
Wind hazard data can typically be obtained from the local wind design standard. However, it is important to note that the design wind speed can be provided in different formats such as 1-min wind speed, 1-hour average wind speed, wind pressure, etc. The hazard info needs to be converted to the equivalent 3s-gust wind speed before being used in the assessment. The Durst Curve, shown in the following figure, can be used as a tool to convert wind speeds between different averaging periods (e.g., 1-hour average wind speed and 3-second gust).

Figure 1. Durst Curve (ASCE 7-22 Commentary Figure C26.5-1) to convert wind speeds between averaging period
Generally, no matter where the wind hazard data is obtained, the data will be input into Iris as part of the risk analysis (discussed in an upcoming section). Even if the wind hazard is negligible, the data will still be input into Iris.
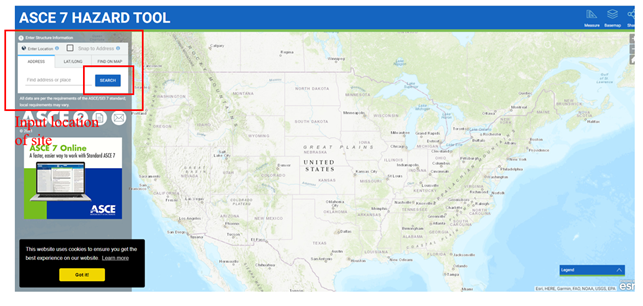
Figure 2: ASCE 7- hazard tool home page. Input site location.

Figure 3: ASCE 7- hazard tool home page. Select code version and risk category.

Figure 4: ASCE 7- hazard tool home page. Input summary.

Figure 5: ASCE 7- hazard tool home page. Wind speed at various return periods for given location.
# 1.2 Analysis
Now that the data has been collected, the risk can be determined for a given building and wind hazard source. The information will be input into Iris to conduct the analysis.
We acknowledge that the current workflow is manual. If the number of buildings to input is too many to do manually, then reach out to Iris point person to learn how to interface with the API and upload the data in batch. In the future, we will have an automated process using the templates provided in the Appendix.
Iris Interface
For a Class 1 assessment, Iris automatically calculates the risk rating once the hazard information and vulnerability information are input for the asset. This section walks through how to input the information and run a Class 1 risk assessment in Iris.
Step 7: Create New Asset in Iris
It is assumed that the reader has logged into Iris and created an appropriate group for this analysis. Please refer to General Iris Guidelines if not and return to this step.
Create an asset for each building by selecting the ‘New Asset’ button in the top righthand corner of the screen (see blue circle in image below).
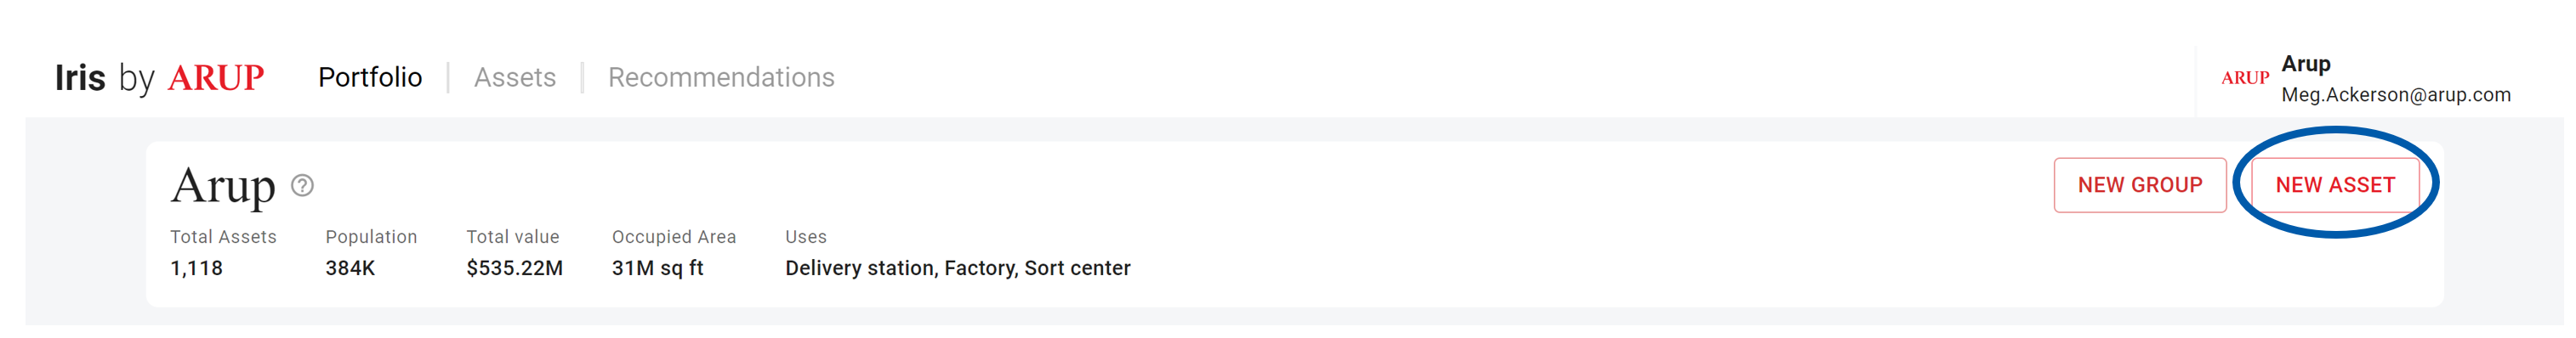
Figure 6: Example Iris home page. Note 'New Asset' button in top righthand corner to create an asset.
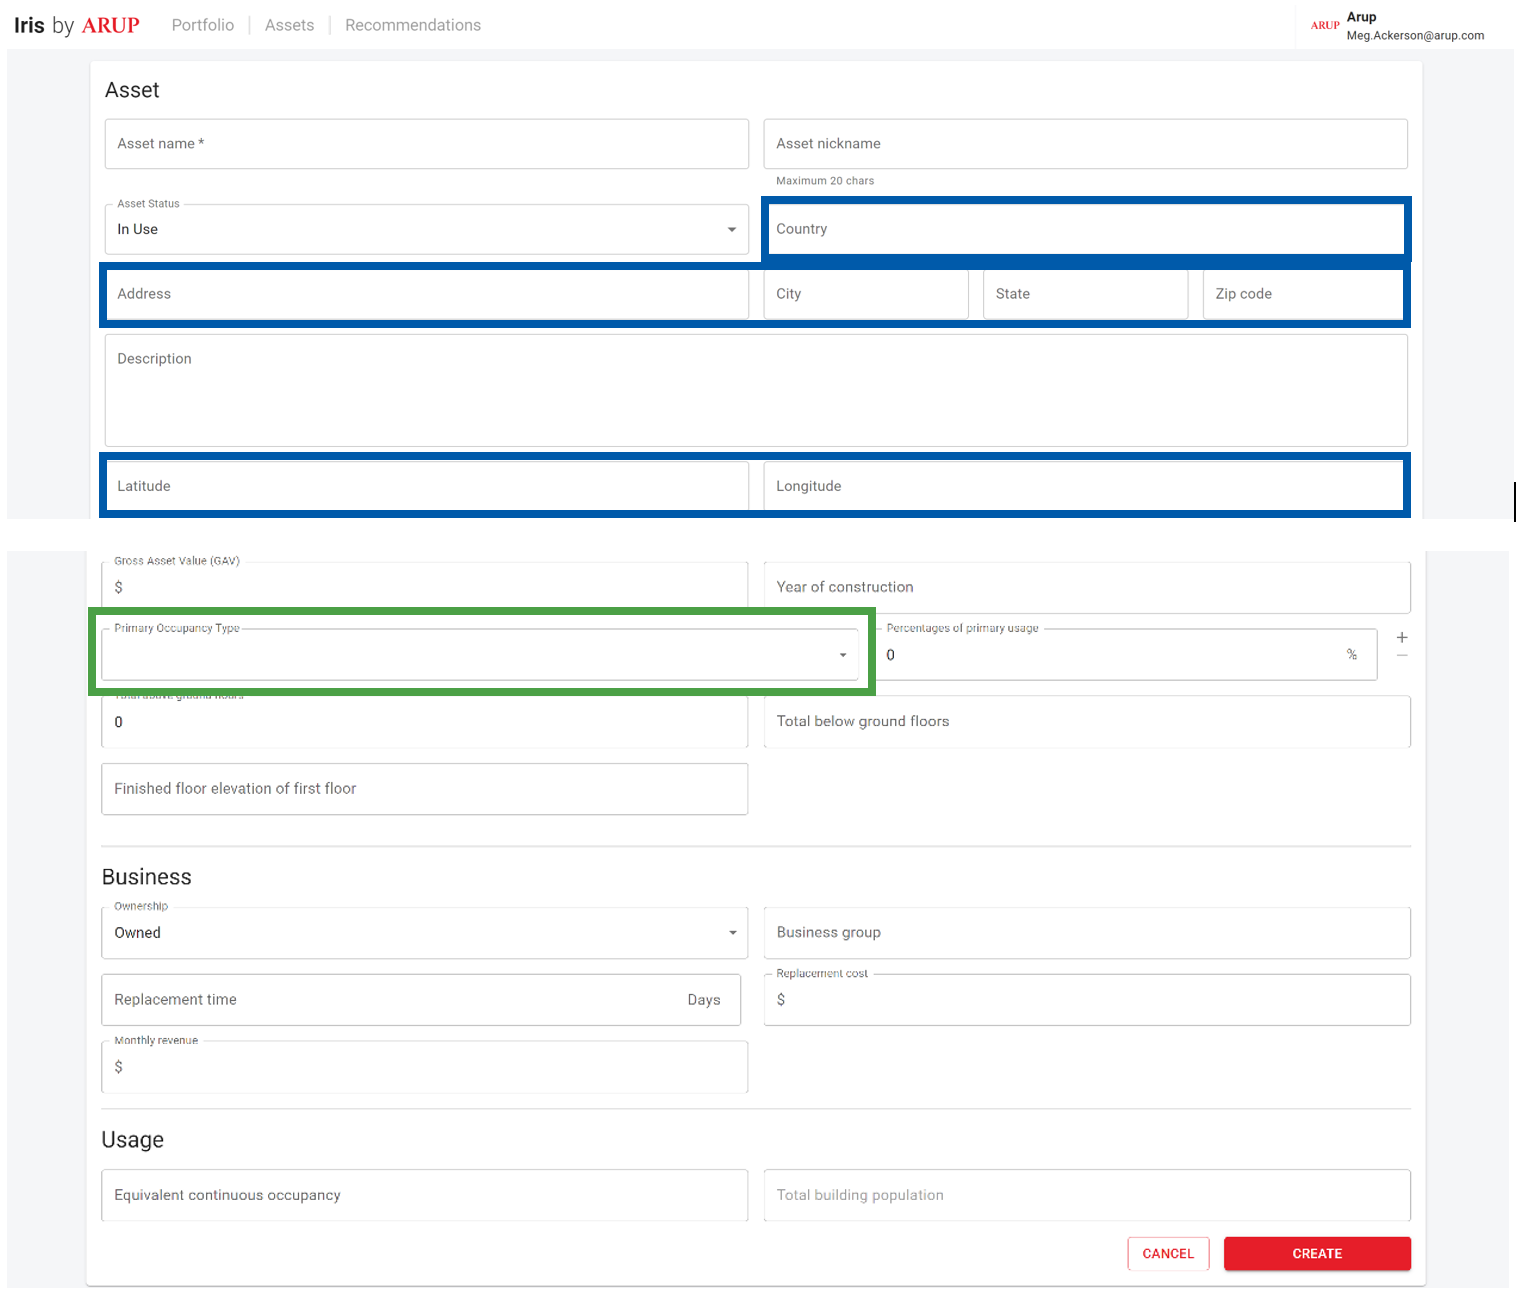
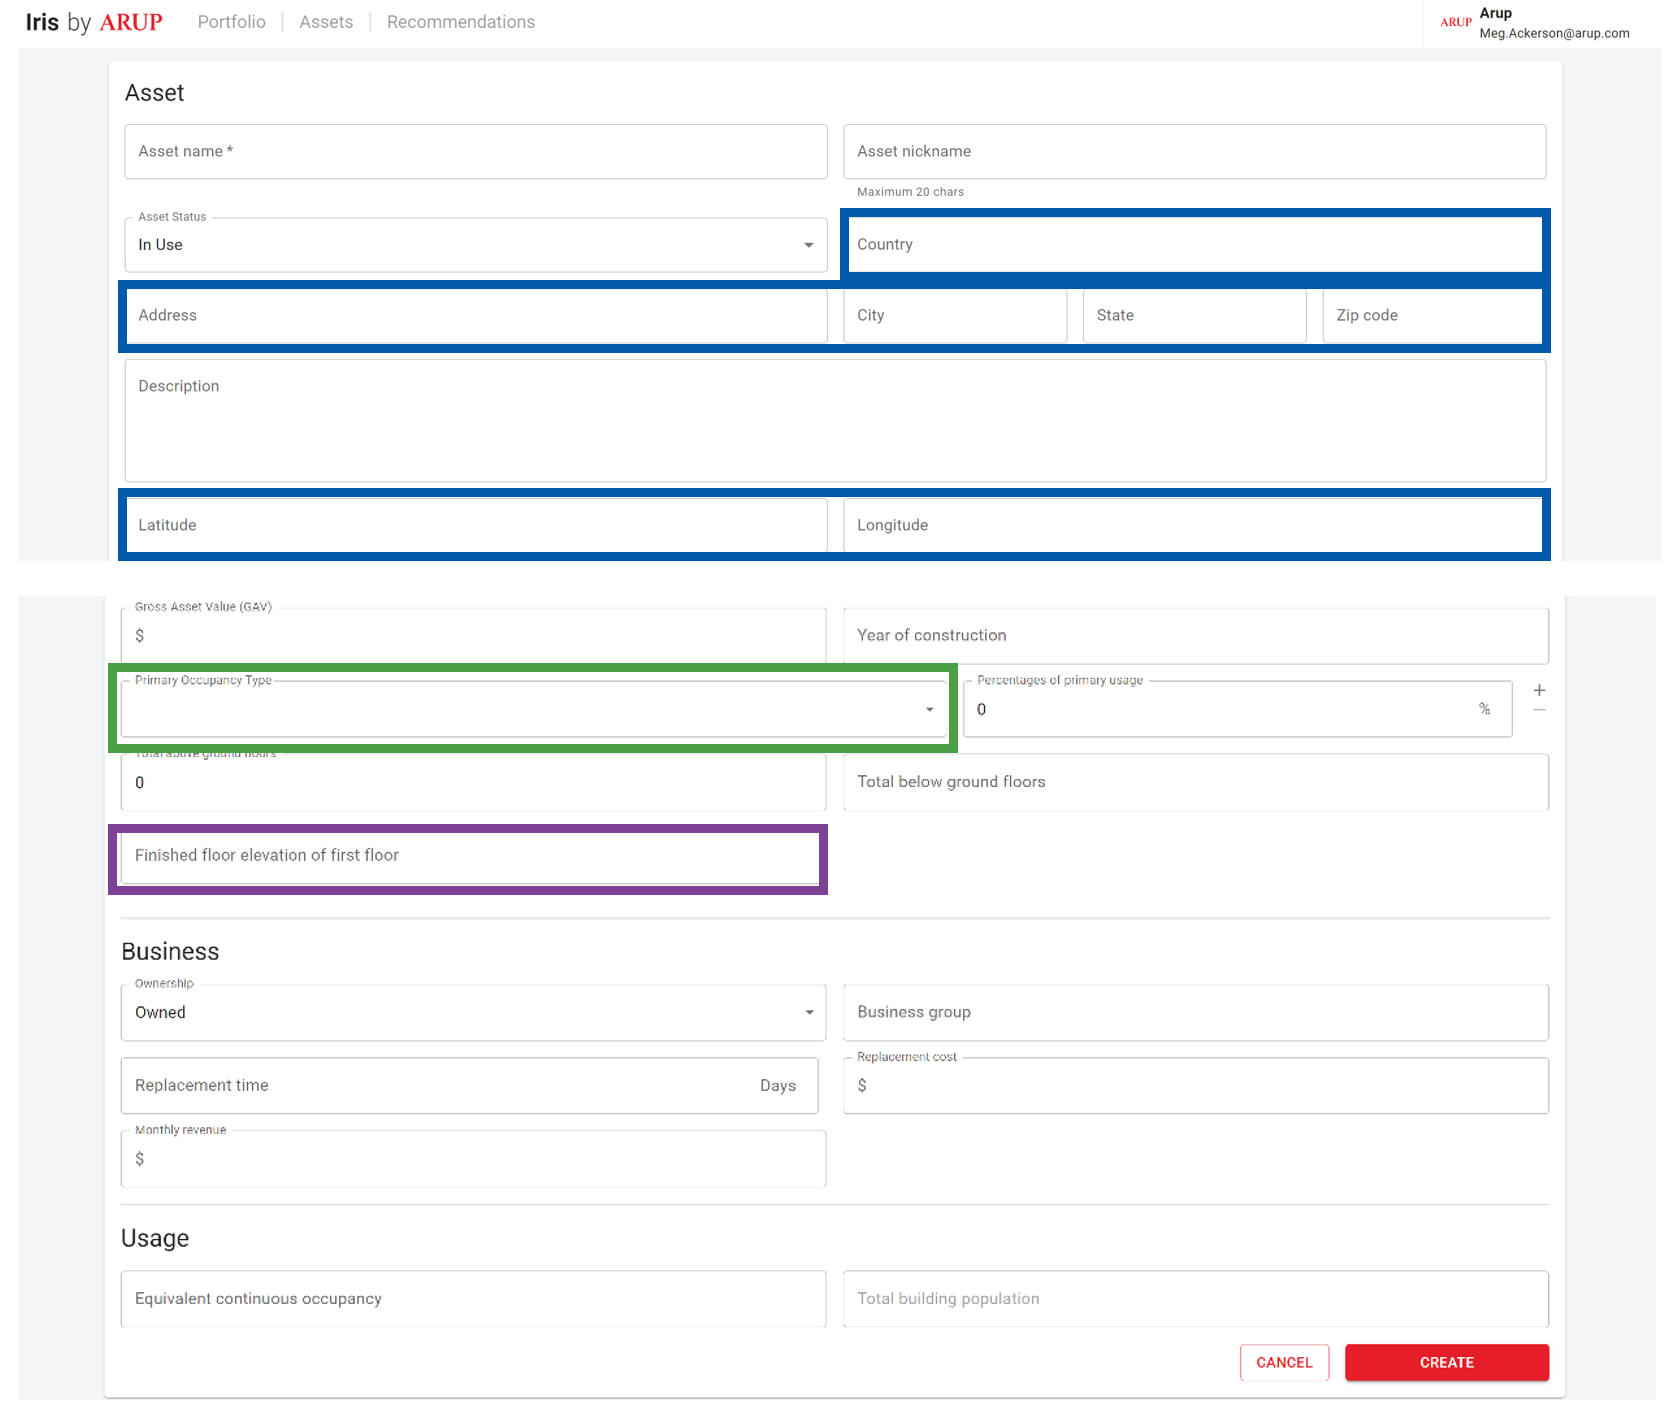
This button leads to the asset creation page, as seen in the next figures. Please fill out the building information that has been collected so far:
Location (Country, Address, City, State, Zip Code, Latitude, Longitude)
Building Use Type (Primary Occupancy Type)
Building Area (add 1 above-ground floor, add building area)
Note that ‘Percentage of primary usage’ should be left blank and that not all Location characteristics need to be known to run an analysis (at a minimum need Latitude and Longitude).
See boxes in the next figure with respective colors of building characteristics.
At the bottom of the page, select ‘Create’ to save the information that has been input and officially create this new asset.
Step 8: Create Risk Assessment
On the Asset page, click on the ‘Create Risk Analysis’ button in the top righthand corner (circled in blue below).
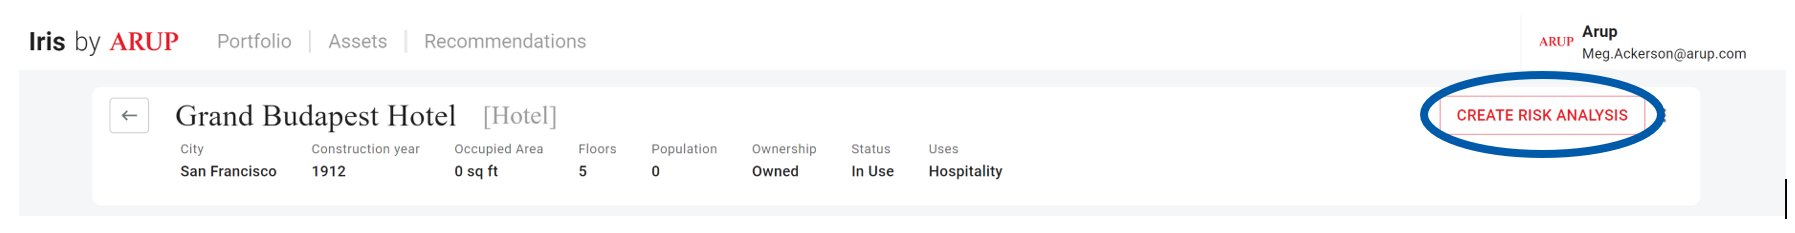 Figure 7: Top of an example asset page that highlights the 'Create Risk Analysis' button.
This button leads to an assessment creation page which asks for some details about the type of assessment. Fill out the Assessment Name with the project phase (e.g., “Phase 1,” “Site Screening”), timeframe (“Present Day 2020” or “Future 2050”), An example assessment name would be “Phase 1 Present Day 2020 Wind Assessment.”
Designate the Hazard Type as “Wind” and Risk Class as “1” to capture the analysis details. The Executive Summary can be left blank for a Class 1 risk assessment. Finally, click on the ‘Create Assessment’ button at the bottom of this page (circled in teal below).
Figure 8: Assessment creation page requires details about the type of assessment being done.
The assessment should now appear under the ‘Risk Metrics’ tab on the asset page. The tab is circled in blue, and the wind assessment details are outlined in green below.
Figure 9: Asset page showing newly created risk assessment on the 'Risk Metrics' tab.
Step 9: Confirm Risk Parameters
Quickly review the risk parameters by selecting the ‘Input Risk Parameters’ button circled in blue below. For class 1, only the surrounding terrain type and time and location factors are shown as input risk parameters.
Terrain type category refers to the surrounding terrain, which can impact the wind speed as it approaches the building. Please see Step 3 above for further information on determining the terrain category.
Time Factor captures cost escalation of construction over time.
Location Factor captures the different costs of construction for a given location compared to the Washington, DC, USA area.
We recommend working with an internal Arup team that specializes in construction costs to obtain the present-day costs in the project region and compare to the provided costs in the Appendix.
Figure 10: The Risk Metrics tab of the asset page highlighting the 'Input Risk Parameters' button.
Figure 11: The input page for risk parameters.
Step 10: Input Hazard Information
At this stage, the hazard information must be added to Iris by clicking the ‘Input Hazard Model’ button on the asset page (same ‘Risk Metrics’ tab as previous step). See screenshot below, where the button is circled in blue.
Figure 12: Risk Metrics tab of an asset page highlighting the 'Input Hazard Model' button.
The hazard model input page should appear once the ‘Input Hazard Model’ button has been clicked. On this page, click the ‘Add Return Period’ button, circled in blue below.
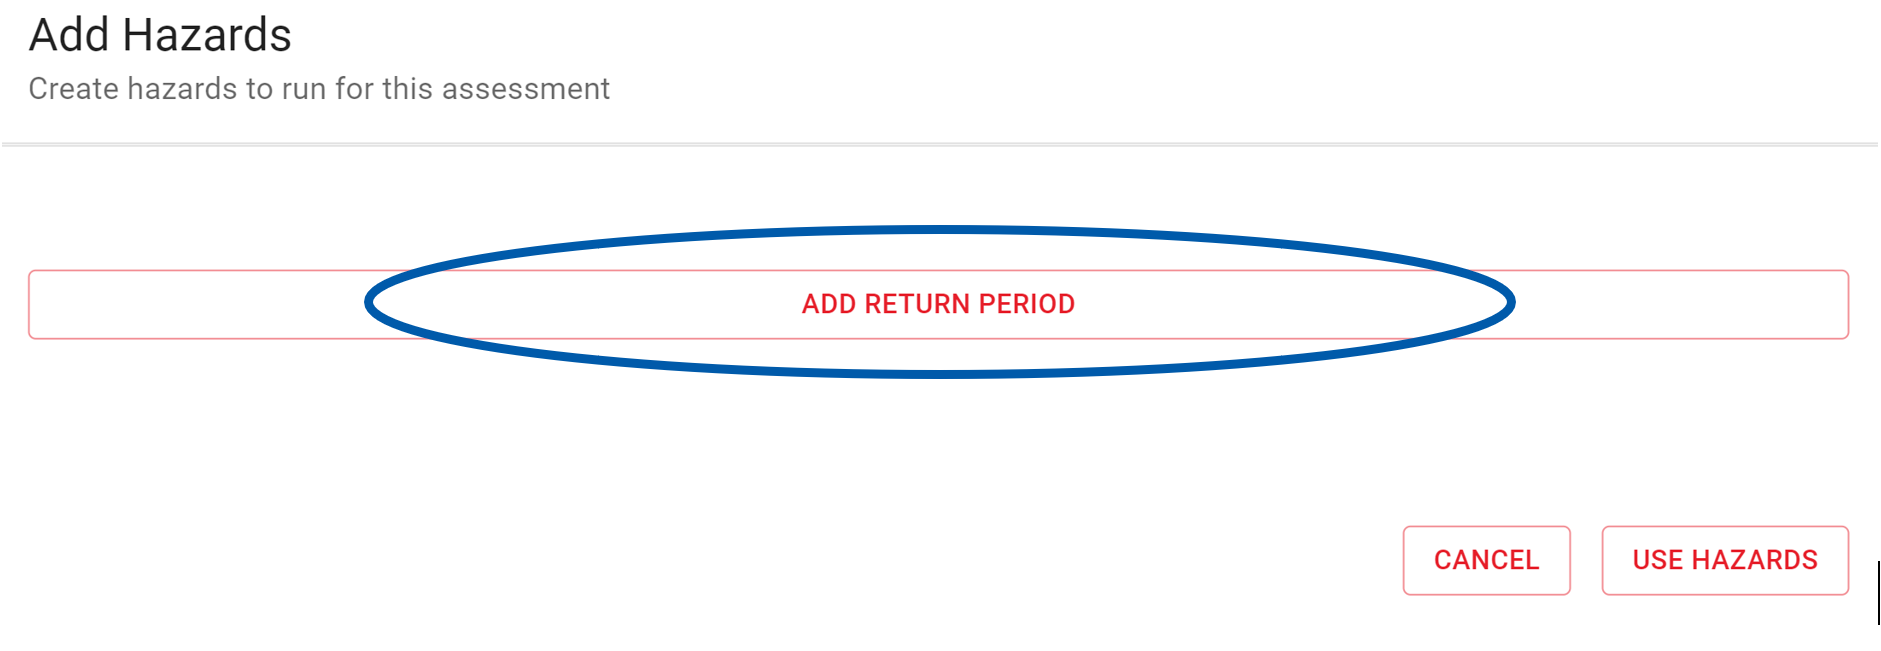
Figure 13: Hazard model input page highlighting the 'Add Return Period' button.
At this step, input each Return Period and the corresponding site 3s-gust wind speed (in units of mph) obtained from the hazard model (see boxes colored accordingly below). Continue to add entries using the same ‘Add Return Period’ button.
Figure 14: Hazard input page highlighting where the return period and depth information should be entered.
Once all return periods have been added, make sure to select the green checkmark (ü) for each return period (seen in previous image on the righthand side) and click on the ‘Use Hazards’ button (circled in blue below)
Figure 15: Hazard inputs page with completed information highlighting the 'Use Hazards' button.
Now this step has been completed. Confirm that the ‘Input Hazard Model’ button has turned green and shows a checkmark like in the image below (circled in blue).
Figure 16: The Risk Metrics tab of the asset page showing the completed step of inputting the hazard model.
Step 11: Run Risk Analysis
Select the ‘Run Risk Analysis’ button to open the analysis page. The button is circled in blue below.
Figure 17: The Risk Metrics tab of the asset page highlighting the ‘Run Risk Analysis’ button.
Confirm that all inputs align with the building data collected, notably:
Assumed Building Characteristics (Building Use Type field, Building Height Category field, Roof Construction Type field, Wind Design Zone field, Missile Environment field) and
Area of building footprint
Time and location factors
If the inputs align with the steps followed so far, then select the ‘Run Risk Analysis’ button (circled in purple below).
Figure 18: The 'Risk Analysis' page which shows the input hazard curve, calculated EDP curve, and the archetype and adjusted loss curves.
Iris will display the risk rating as well as the range of the annualized quantitative results. Return period results are also shown however, these should NOT be published for the client to view, they should be used for internal QA purpose for the Class 1 risk assessment. See the example below.
Figure 19: The completed 'Risk Metrics' tab showing the results of a Class 1 analysis.
# Class 2 Assessment
# 1. Downtime and Repair Cost
Follow the steps outlined in this section to obtain downtime and repair cost risk rating for Class 2 wind risk analysis of buildings.
This process will assign a vulnerability archetype to the building. Two vulnerability curves are associated with each archetype:
Wind speed-loss curve, which relates repair costs (in USD) to wind speed
Wind speed-downtime curve, which relates downtime (in days) to wind speed
The hazard data for each site, the building exposure information, and the vulnerability curves will be combined to produce risk results for this Class 2 Assessment.
# 1.1 Data Collection
Collect all required input data before putting into Iris. The data is best collected into a spreadsheet; see the Class 2 template linked in the Appendix.
Exposure and Vulnerability
Building use type, roof construction type, number of stories, design wind zone, missile environment, and surrounding terrain category are required to conduct a class 2 vulnerability assessment. These six characteristics allow the analyst to select the proper vulnerability archetype. Additionally, the building location must be collected to run the analysis. See the following steps to collect the relevant data.
Step 1: Collect Building Location Data
The building location should be determined as the centroid of the building footprint and provided as a latitude and longitude in degrees.
Step 2: Building Use Type
The building occupancy type needs to be selected when creating the asset. Iris has pre-defined building occupancy types for the user to select from. One use type (also called occupancy type) should be selected for each asset. If the building has multiple uses, select the use of the upper floors, which typically would be the floors see more wind damage.
The selected occupancy type will be mapped to one of the building occupancy types of the pre-defined archetypes. See Table 1 for reference of the mapping.
Step 3: General Surrounding Terrain Type
The surrounding terrain condition could affect the wind speed when it approaches the building. An open terrain condition could result into a higher local wind speed where the building component will see compared to a terrain where many other buildings are around in an urban dense area. Based on the building surrounding from satellite view, the analyst needs to select one of the general terrain types for the assessment. For each terrain type, the input hazard which is supposed to be the open terrain wind speed will be adjusted for the local terrain location with pre-defined wind speed adjustment factor. See Table above for further detail on how to determine the wind speed adjustment factor based on surrounding terrain type.
Step 4: Building Roof Construction Type
The critical aspect for roof construction type is whether the building has a concrete or built-up roof because extreme winds can cause structural damage to built-up roofs. It is assumed that buildings with built-up roofs have a form of wall construction (e.g., concrete tilt-up or light-frame construction) that can incur structural damage in extreme winds.
| Roof Construction Type (for Iris) | Description |
|---|---|
| Concrete roofing | Roofing is concrete with actual steel or concrete framing system. |
| Built-up roofing | Roofing is built-up roof, such as deck on joist, wood panel on joist etc. This typically exists for concrete tilt-up construction, light frame construction. |
Step 5: Building Story Number
The number of stories needs to be input when creating the asset. Based on the number of stories input, the building will be mapped to one of the archetypes heigh range. Please see the table below for the mapping.
| Building Height (for Iris) | Industrial Datacenter | Commercial | Residential |
|---|---|---|---|
| Low-rise | 1+ | 1-2 | 1-2 |
| Mid-rise | NA | 3-7 | 3-7 |
| High-rise | NA | NA | 8+ |
Step 6: Design Wind Zone
Wind vulnerability of the building structure depends on the wind-resisting capacity of the building components. The same building components could resist different levels of wind if they are designed based on different levels of wind demand following the wind design code. For example, in Florida, a window can resist a much higher wind speed before failure compared to a window in California. The wind archetypes were developed based on different assumptions of component resistance. Archetypes were developed with three levels of wind resistance, corresponding to whether a building was designed within a High, Medium, or Low wind zone. To determine the wind design zone, the design wind speed needs to be first obtained from the building design code. For example, in the U.S., the design wind speed is defined in the map below (Figure 20).
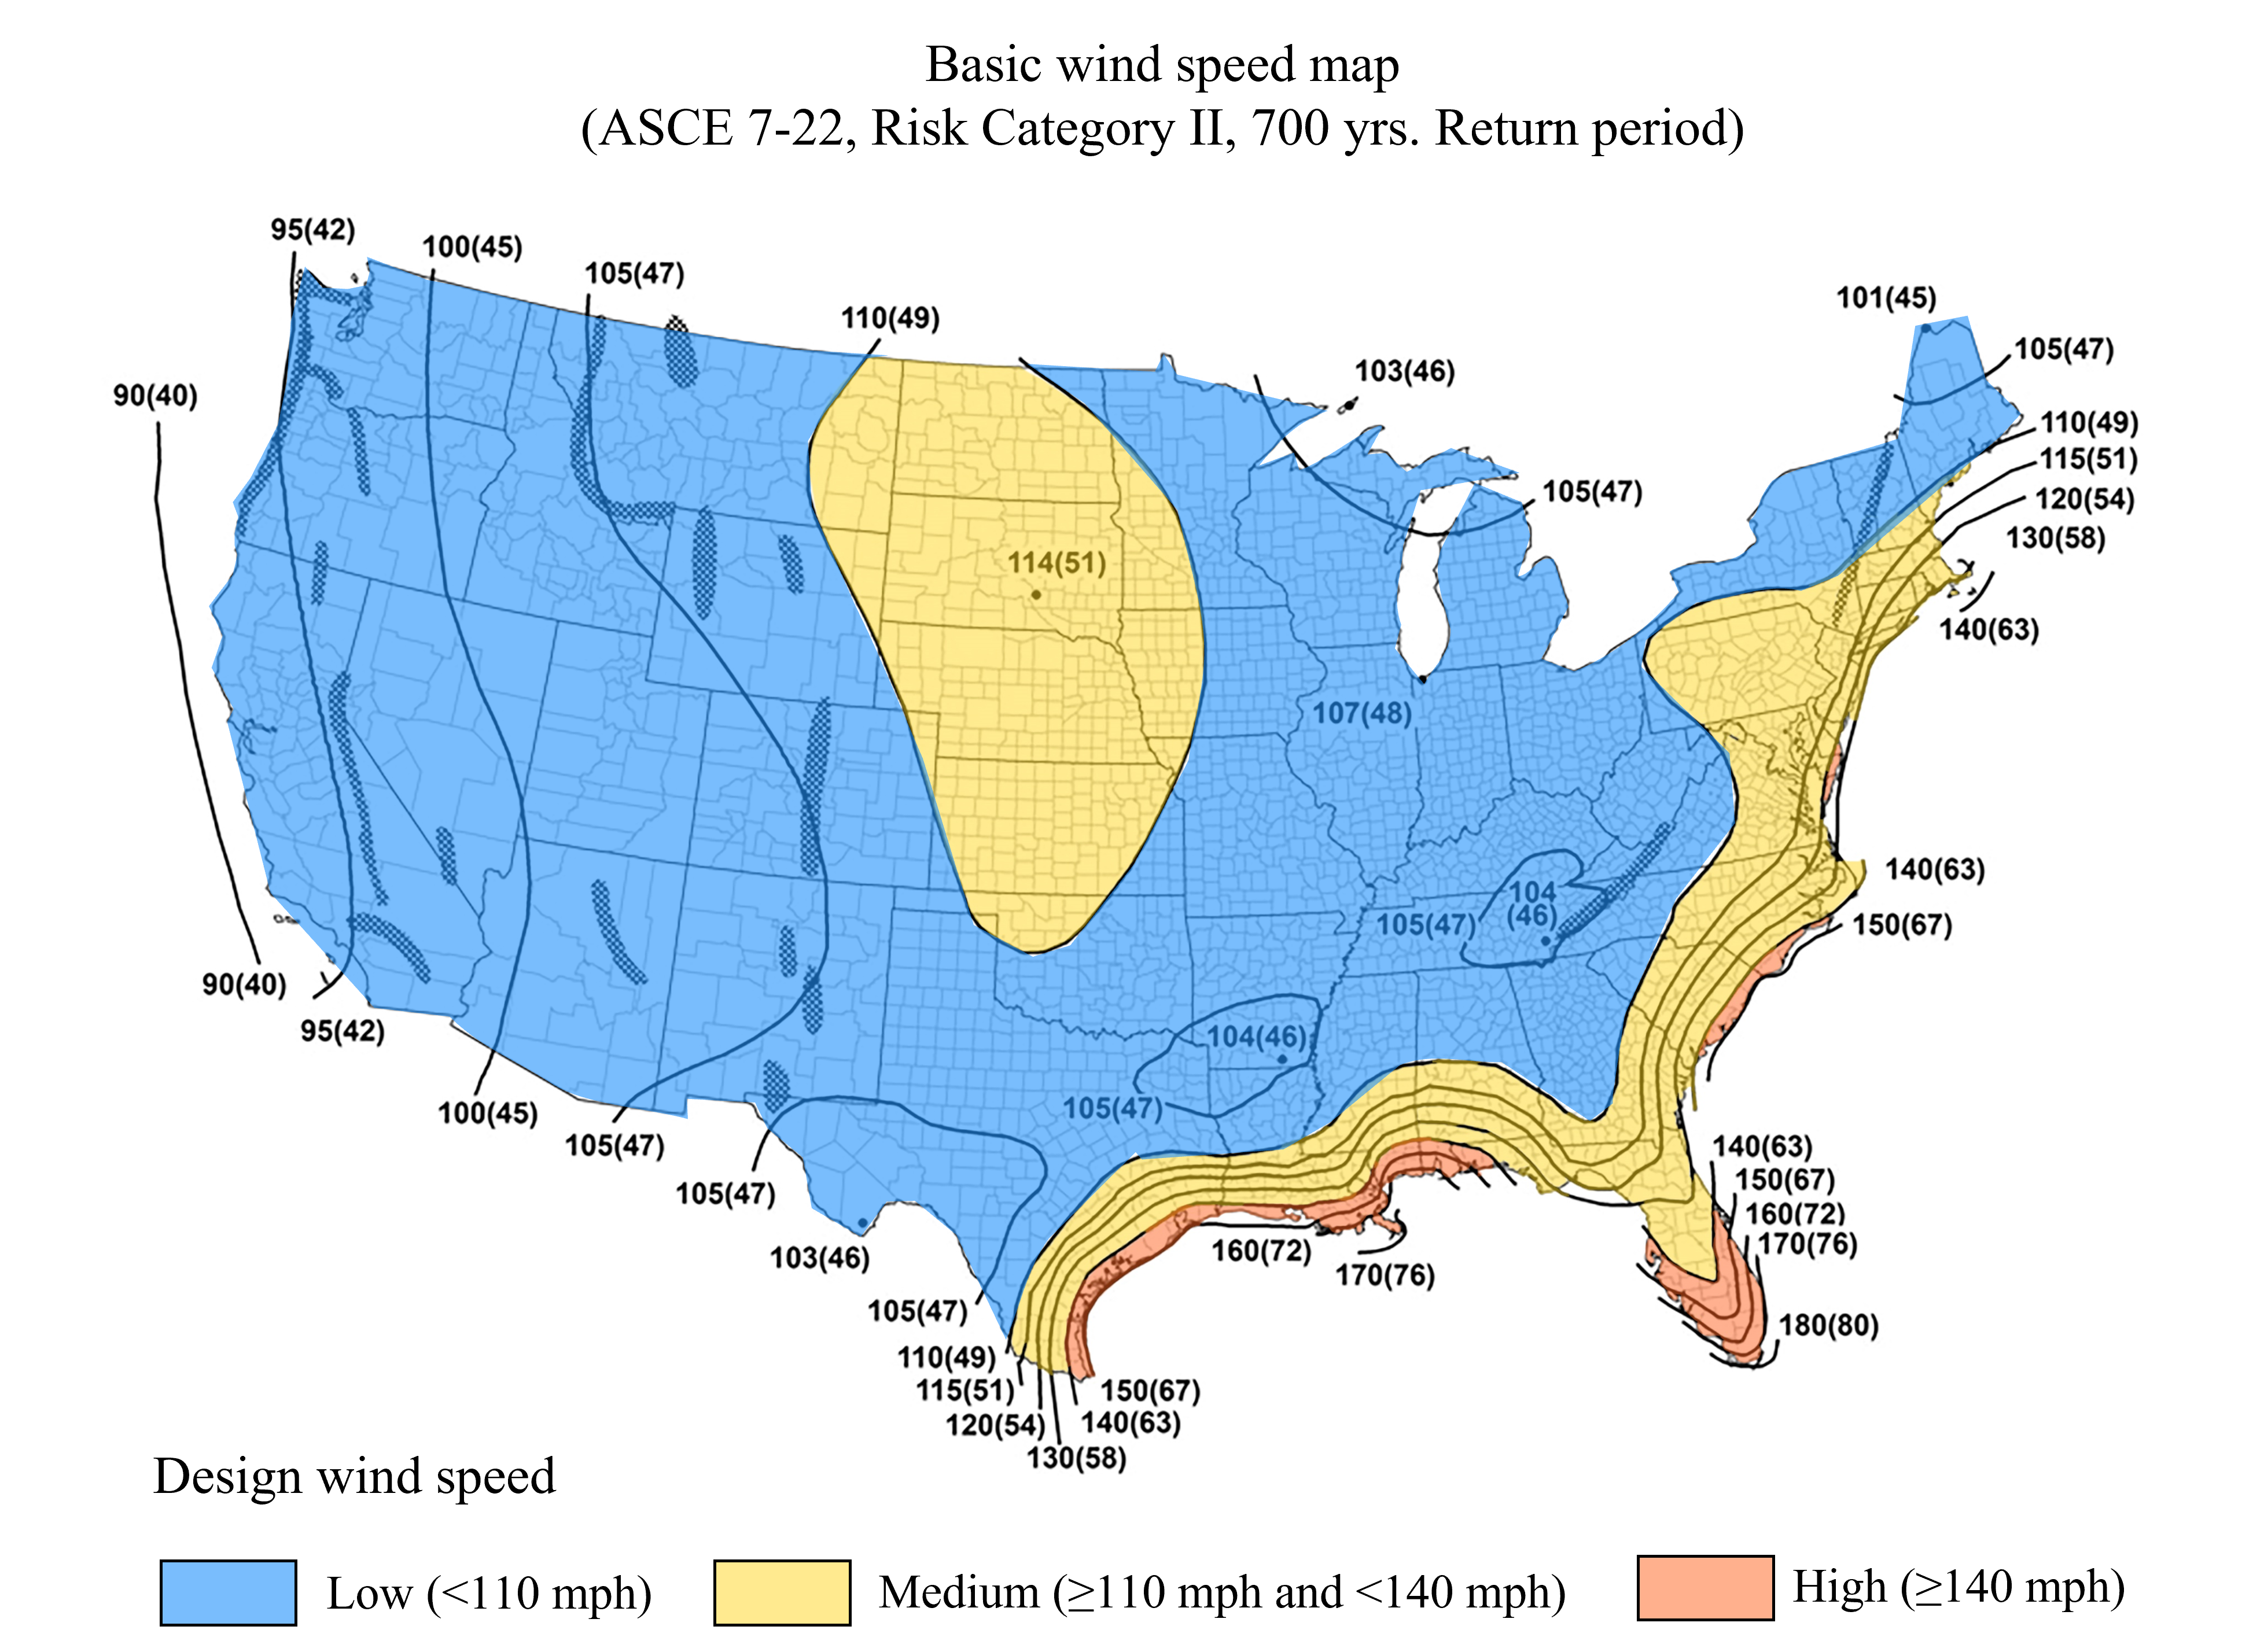
Figure 20: Design wind speed map for U.S.
Considering the evolution of building design code and the deterioration of component capacity due to ageing and fatigue, the design wind speed is adjusted based on the construction year to determine the wind design zone, as shown in Figure 21.
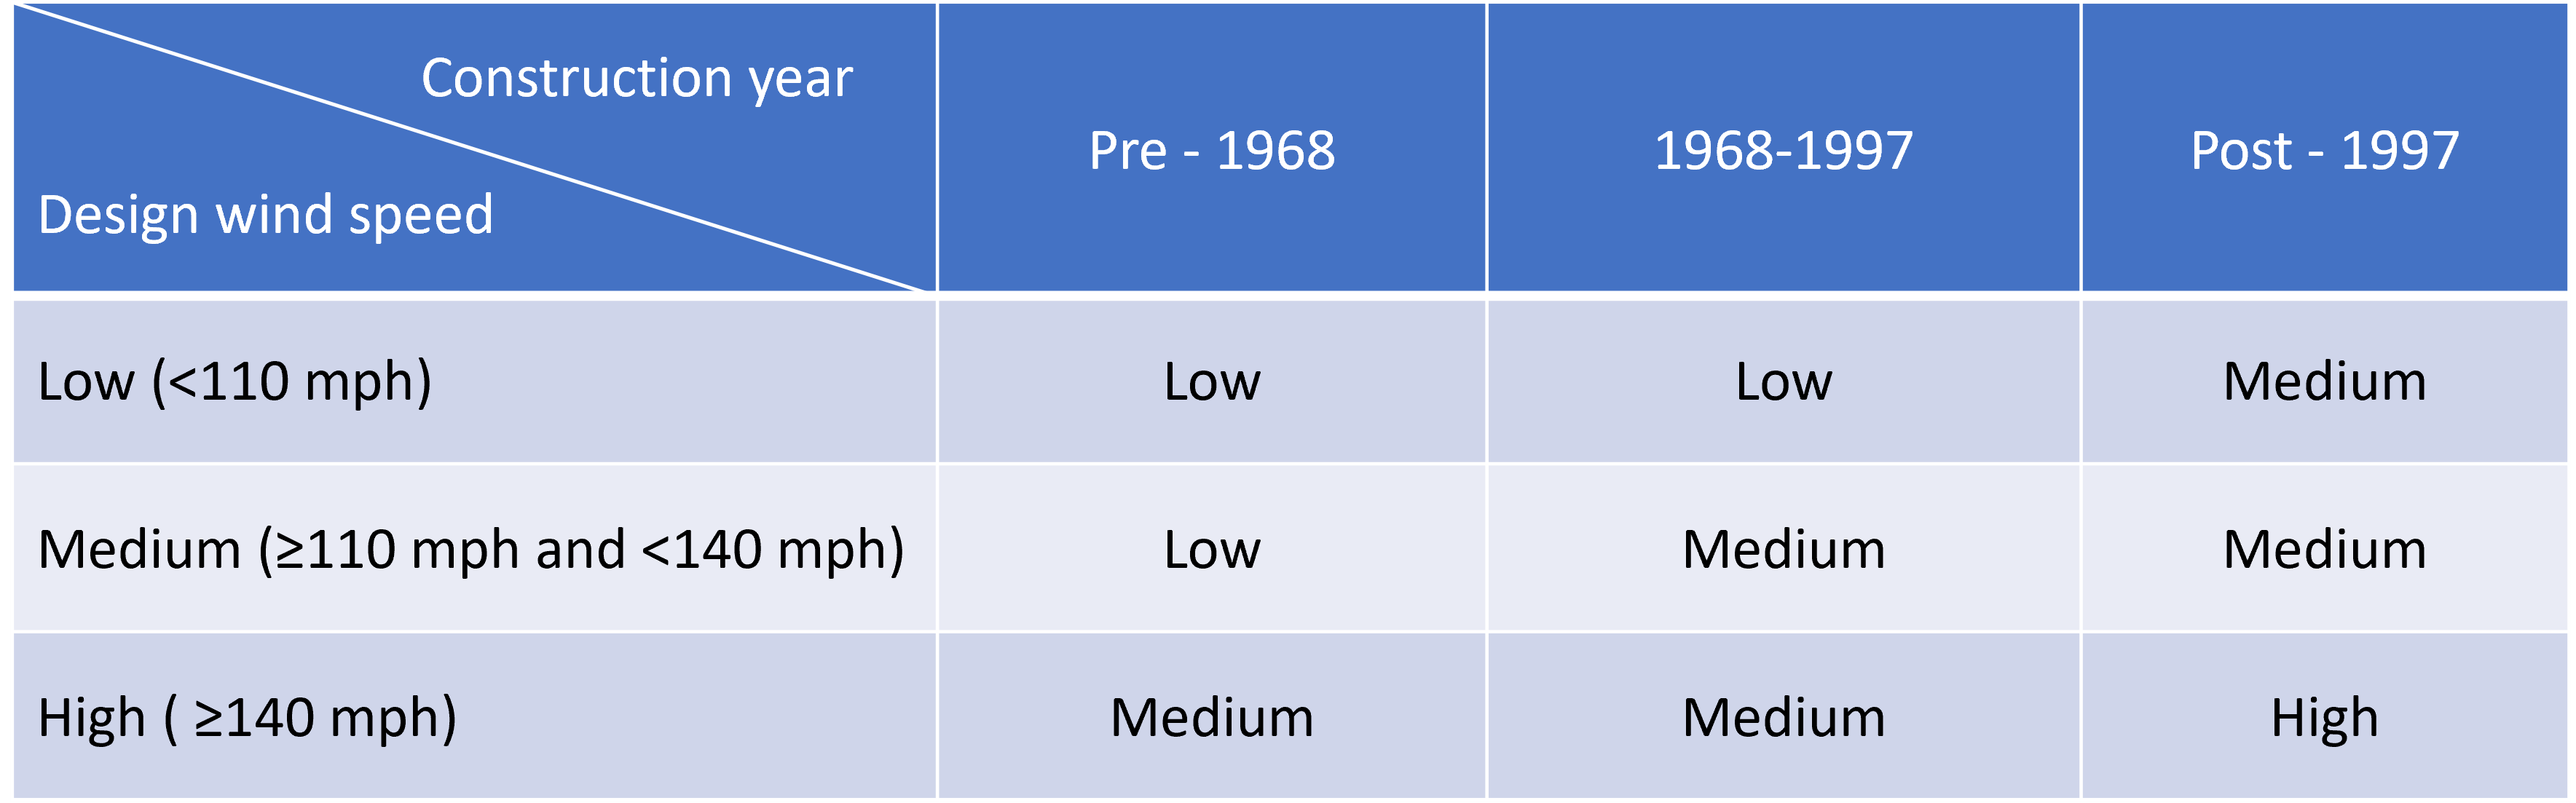
Figure 21: Design wind zone categorization for U.S.
Step 7: Missile Environment
During a high wind event, wind driven missile/debris can be generated. They can hit the envelope of the building and result in significant damage to the building envelope in addition to the damage caused by the wind pressure. The impact of this effect largely depends on how much missile source is around the building. Analysts need to specify a missile environment category: High missile environment or Low missile environment. Please see the table below for guidance.
Table 4: Missile environment categorization
| Missile environment category | Description |
|---|---|
| High missile environment | Urban area or mix of residential and commercial area, high building density 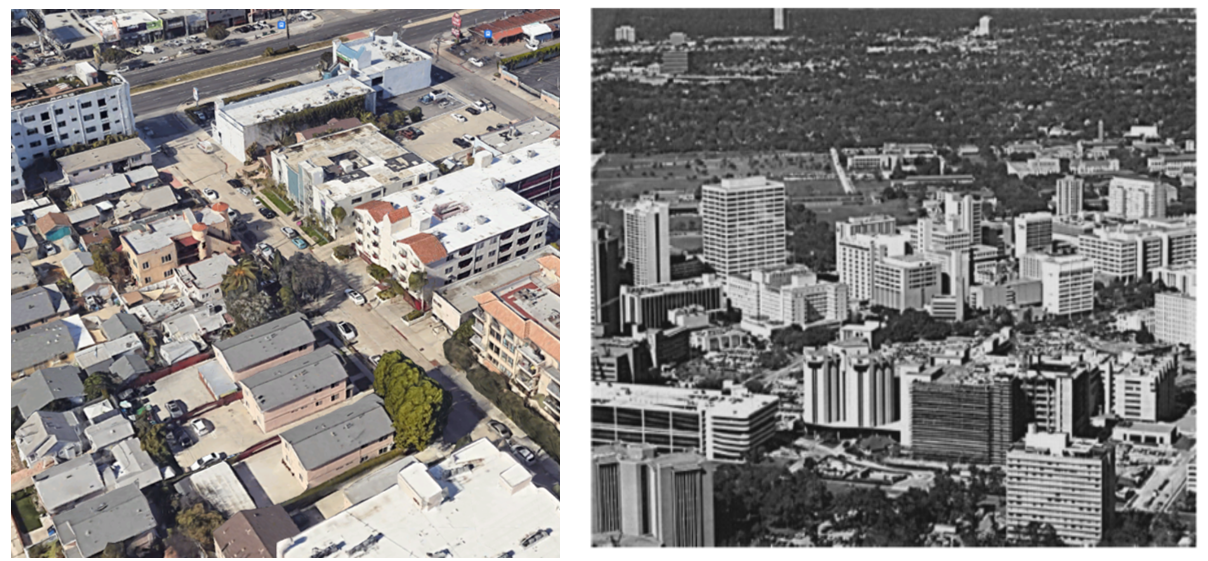 |
| Low missile environment | Suburban region residential area, low building density 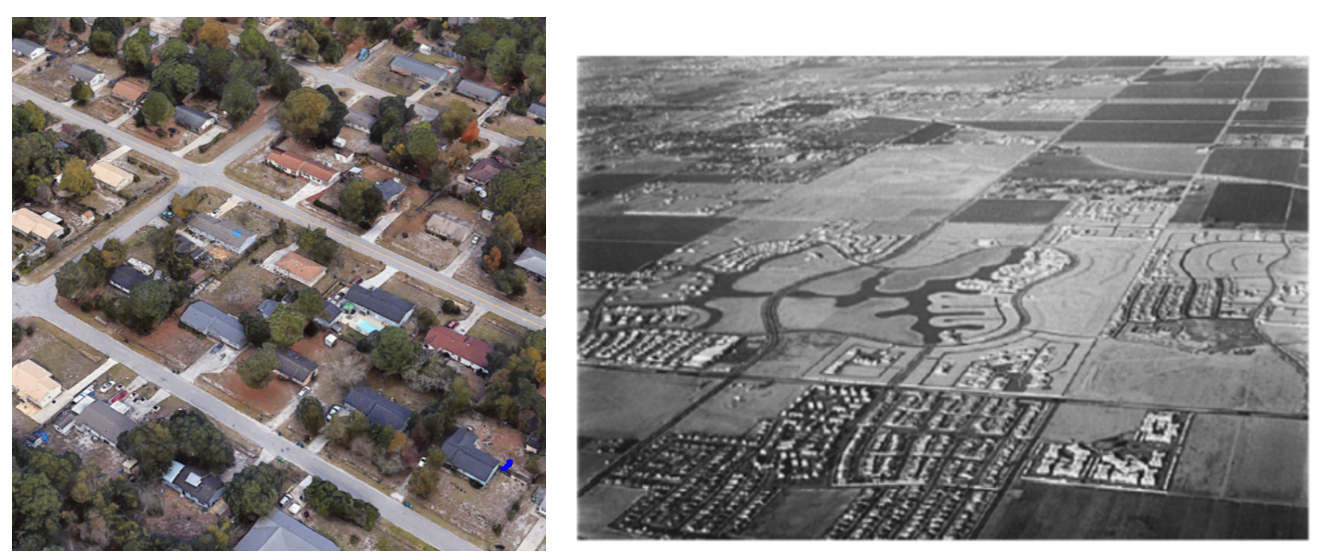 |
Hazard The main hazard input required to conduct the wind risk assessment is the 3s-gust wind speed. The location of the asset needs to be known to obtain the hazard data. The 3s-gust wind speed at multiple return periods is typically needed.
Step 8: Obtain Hazard Data
For US-based sites (including Puerto Rico):
The wind hazard can be obtained from the ASCE 7 online tool as shown in the figures below. Users need to first put the address or latitude/longitude coordinate of the site in the home page of the tool (see circled location in Figure 1 above). After the site is located, select ASCE 7-22 code version and Risk Category II as shown Figure 2 above. Then after clicking the “View Results” button, the wind speed at various return period of the site could be seen by viewing the “Summary” sheet as shown in Figures 3 and 4 above.
If you or your client want to customize the wind hazard because you have location-specific wind hazard results for your asset, you can input customized data for return periods of your or your client's choice. Ideally multiple return periods are needed for the hazard input.
For non-US-based sites: Wind hazard data can typically be obtained from the local wind design standard. However, it is important to note that the design wind speed can be provided in different formats such as 1-min wind speed, 1-hour average wind speed, wind pressure, etc. The hazard info needs to be converted to the equivalent 3s-gust wind speed before being used in the assessment. The Durst Curve, shown in Figure 1 above, can be used as a tool to convert wind speeds between different averaging periods (e.g., 1-hour average wind speed and 3-second gust). Generally, no matter where the wind hazard data is obtained, the data will be input into Iris as part of the risk analysis (discussed in an upcoming section). Even if the wind hazard is negligible, the data will still be input into Iris .
# 1.2. Analysis
Now that the data has been collected, the risk can be determined for a given building and wind hazard source. The information will be input into Iris to conduct the analysis. We acknowledge that current workflow is manual. If the number of buildings to input is too many to do manually, then reach out to Iris point person to learn how to interface with the API and upload data in batch. In the future, we will have an automated process using the templates provided in the Appendix.
Iris Interface
For a Class 2 assessment, Iris automatically calculates the risk metrics once the hazard information and vulnerability information are input for the asset. This section walks through how to input the information and run a Class 2 risk assessment in Iris.
Step 9: Create New Asset in Iris
It is assumed that the reader has logged into Iris and created an appropriate group for this analysis. Please refer to General Iris Guidelines if not and return to this step. Create an asset for each building by selecting the ‘New Asset’ button in the top righthand corner of the screen (see blue circle in image below).
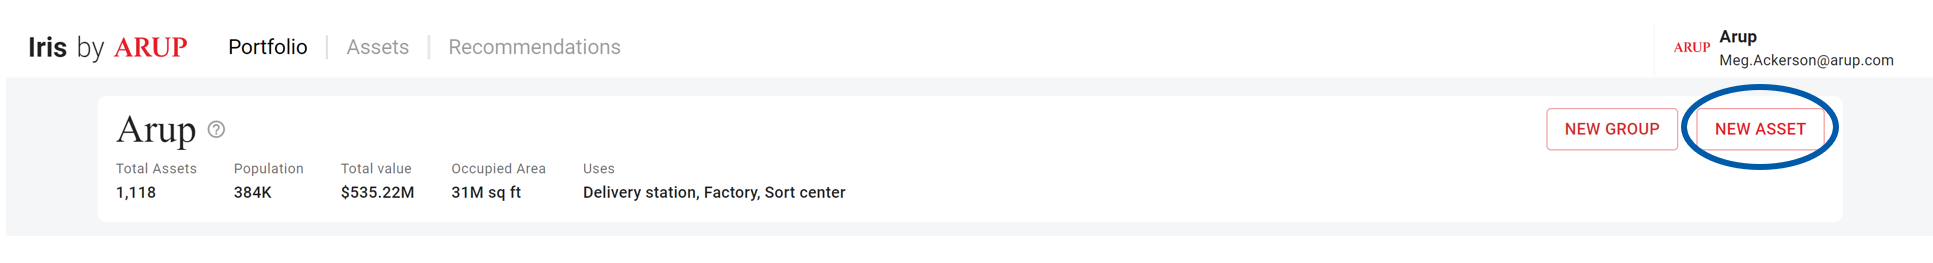
Figure 21: Example Iris home page. Note 'New Asset' button in top righthand corner to create an asset.
This button leads to the asset creation page, as seen in the next figures. Please fill out the building information that has been collected so far.
- Location (Country, Address, City, State, Zip Code, Latitude, Longitude),
- Building Use Type (Primary Occupancy Type),
- Number of Stories (Number of floors above ground level), See boxes in the next figure with respective colors of building characteristics.
At the bottom of the page, select ‘Create’ to save the information that has been input.
Step 10: Create Risk Assessment
On the newly created Asset page, click on the ‘Create Risk Analysis’ button in the top righthand corner (circled in blue below).
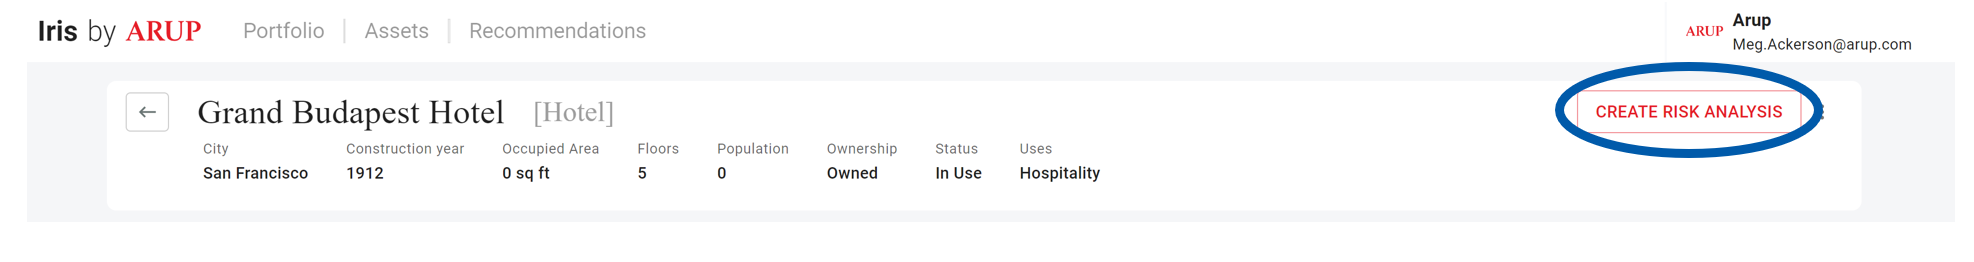
Figure 22: Top of an example asset page that highlights the 'Create Risk Analysis' button.
This button leads to an assessment creation page which asks for some detail about the type of assessment. Fill out the Assessment Name with the project phase (e.g., “Phase 1,” “Site Study”) and timeframe (“Present Day 2020” or “Future 2050”). An example assessment name would be “Phase 1 Present Day 2020 Wind Assessment.” Designate the Hazard Type as “Flood” and Risk Class as “2” to capture the analysis details. The Executive Summary can be left blank for a Class 2 risk assessment. Finally, click on the ‘Create Assessment’ button at the bottom of this page (circled in teal below).
Figure 23: Assessment creation page requires details about the type of assessment being done.
The assessment should now appear under the ‘Risk Metrics’ tab on the asset page. The tab is circled in blue and the flood assessment details are outlined in green below.
Figure 24: Asset page showing newly created risk assessment on the 'Risk Metrics' tab.
Step 11: Input and Confirm Risk Parameters
Input the risk parameters by selecting the ‘Input Risk Parameters’ button. This button opens up the risk parameters page. Select the ‘Update Risk Parameters’ button when done to ensure the parameters have been provided (circled in green below).
Figure 25: The Risk Metrics tab of the asset page highlighting the 'Input Risk Parameters' button.
The following risk parameters will be shown, and the user needs to input all parameters by using the dropdown button. If “not known” is selected, a default value would be used.
| Risk Parameter | Description |
|---|---|
| Roof Construction Type | Roof construction type refers to whether the roof is a concrete or built-up roof. Please see Step 4 above for further detail on determining the roof construction type. |
| Design Wind Zone | Design wind zone captures the wind speed components would have been designed to resist. Please see Step 6 above for further details on determining the design wind zone. |
| Missile Environment Category | Missile environment category captures the potential risk from debris/missiles based on the surrounding environment. Please see Step 7 above for further details on identifying the missile environment. |
| Terrain Type Category | Terrain type category refers to the surrounding terrain, which can impact the wind speed as it approaches the building. Please see Step 3 above for further information on determining the terrain category. |
| Time factor | Time Factor captures cost escalation of construction over time. We recommend working with an internal Arup team that specializes in construction costs to obtain the present-day costs in the project region and compare to the provided costs in the Appendix. |
| Location factor | Location Factor captures the different costs of construction for a given location compared to the Washington, DC, USA area. We recommend working with an internal Arup team that specializes in construction costs to obtain the present-day costs in the project region and compare to the provided costs in the Appendix |
Figure 26: The input page for risk parameters. Check and update button to confirm review .
Step 11: Input Hazard Information
At this stage, the hazard information must be added to Iris by clicking the ‘Input Hazard Model’ button on the asset page (same ‘Risk Metrics’ tab as previous step). See screenshot below, where the button is circled in blue.
Figure 27: Risk Metrics tab of an asset page highlighting the 'Input Hazard Model' button.
The hazard model input page should appear once the ‘Input Hazard Model’ button has been clicked. On this page, click the ‘Add Return Period’ button, circled in blue below.
Figure 28: Hazard model input page highlighting the 'Add Return Period' button.
At this step, input each Return Period and the corresponding site 3s gust wind speed (in units of mph) obtained from the hazard model (see boxes colored accordingly below). Continue to add entries using the same ‘Add Return Period’ button.
Figure 29: Hazard input page highlighting where the return period and depth information should be entered.
Once all return periods have been added, make sure to select the green checkmark () for each return period (seen in previous image on the righthand side) and click on the ‘Use Hazards’ button (circled in blue below).
Figure 30: Hazard inputs page with completed information highlighting the 'Use Hazards' button.
Now this step has been completed. Confirm that the ‘Input Hazard Model’ button has turned green and shows a checkmark like in the image below (circled in blue).
Figure 31: The Risk Metrics tab of the asset page showing the completed step of inputting the hazard model.
Step 12: Run Risk Analysis
Select the ‘Run Risk Analysis’ button to open the analysis page. The button is circled in blue below.
Figure 32: The Risk Metrics tab of the asset page highlighting the ‘Run Risk Analysis’ button.
Confirm that all inputs align with the building data collected and the instructions in the Vulnerability section (including the provided assumptions for Class 2 risk assessments), notably:
- Assumed Building Characteristics (Building Use Type field, Building Height Category field) and
- Roof construction type
- Design wind zone
- Missile environment categorization
- General terrain categorization
- Time factor
- Location factor If the inputs align with the steps followed so far, then select the ‘Run Risk Analysis’ button (circled in purple below).
**Figure 33: The 'Risk Analysis' page which shows the input hazard curve, calculated EDP curve, and the archetype and adjusted loss curves. **
Iris will display the results by return period on the ‘Risk Metrics’ tab. See the example below.
Figure 34: The completed 'Risk Metrics' tab showing the results of a Class 1 analysis.
For a Class 2 Assessment, these are the final results in the form of risk metrics. These results can be published so that the client can view them by selecting the ‘Publish’ button (circled in blue above). If the client would like qualitative risk ratings based on these results, please follow the Class 1 assessment.
# Supplemental References
| Source | Link |
|---|---|
| ASCE/SEI 7-22 | https://asce7hazardtool.online/ |
# Glossary
3-second wind gust
The 3-second gust at 33 ft (10 m) above the ground is the wind speed used in the wind assessment. It represents the highest average speed measured over a 3-second interval. Wind hazard data might be reported in different formats (e.g., 1-minute average or 1-hour average). In regions outside of the US, if the wind hazard data is in a different format, it should be converted to a 3-second gust before conducting the wind assessment.
Design wind zone
The design wind zone refers to the design wind speed for which the building and its components are designed to. This value is used to determine the capacity of the components used in the wind assessment. While the design wind speed/wind zone are often reflective of the wind hazard at a specific return period, wind hazard data should be collected separately from the design wind zone.
# Appendix
Data Collection Templates
Class 1 template: Wind C1 Data Template.xlsx
Class 2 template: Wind C2 Data Template.xlsx